
Observability Tour
Everything the gateway does is observable: dashboards for the questions executives ask, logs for the questions engineers ask, and Prometheus metrics for the machines. This tour walks the read side of the platform — pair it with the governance tour, which generates interesting data to look at.
Mission Control
Section titled “Mission Control”Mission Control is the operations dashboard in the Admin Console, organized into tabs:
| Tab | What it answers |
|---|---|
| Overview | Health at a glance — traffic, spend, error rate and governance KPIs for the selected period. |
| Cost | FinOps view: dollars by model, provider, resource group and modality (chat, images, speech, transcription, video). |
| Governance | Guardrail blocks, policy decisions and enforcement outcomes — what was stopped, redacted or warned, and why. |
| Agents | Agent activity and authorization decisions for A2A and agent-identity traffic. |
| Usage | Requests and tokens over time, sliced by model, group and user. |
| Reliability | Latency, error rates, provider health and throughput — the SRE view. |
| Alerts | Fired usage and budget alerts, with their thresholds and current utilization. |
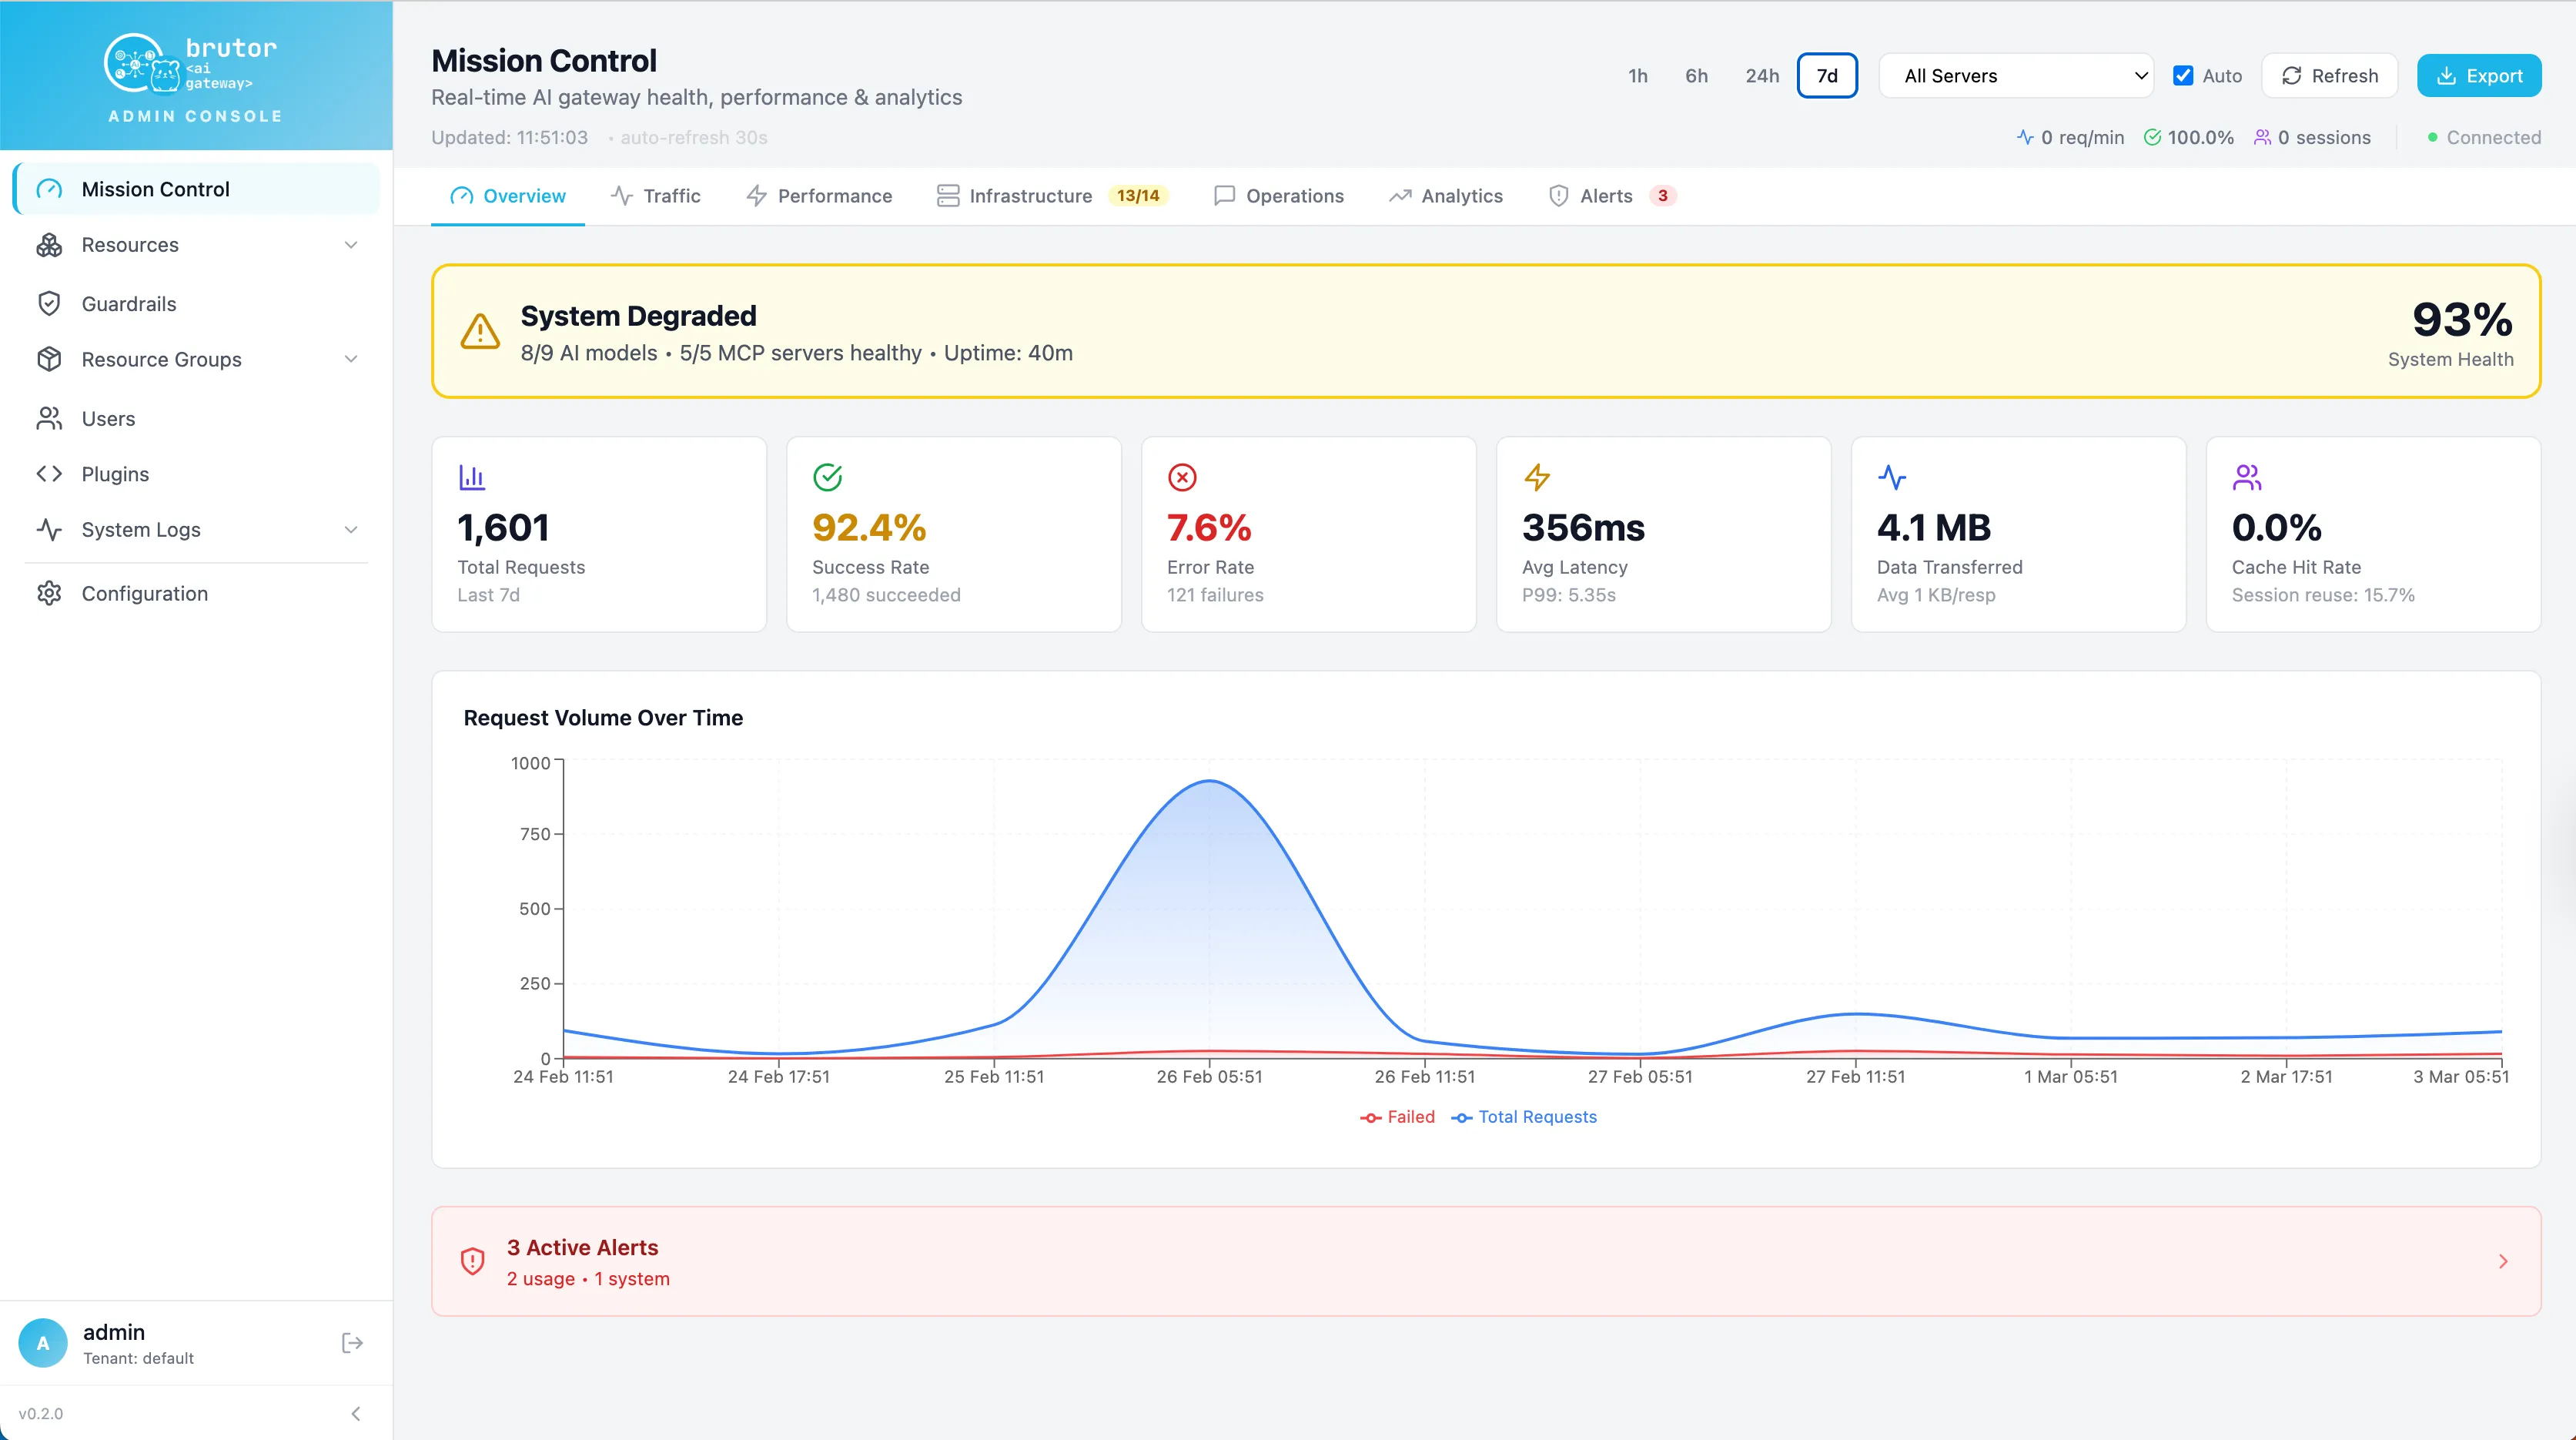
Two selectors apply across tabs:
- Time range — 24 hours, 7 days, 30 days, 90 days or All Time (persisted per browser).
- Plane — Governed (inline traffic the gateway proxied and enforced policy on), Observed (telemetry imported from provider admin APIs via Traffic Data Import — observability only, never enforced), or All. This keeps enforced and merely-imported numbers honest when you use both.
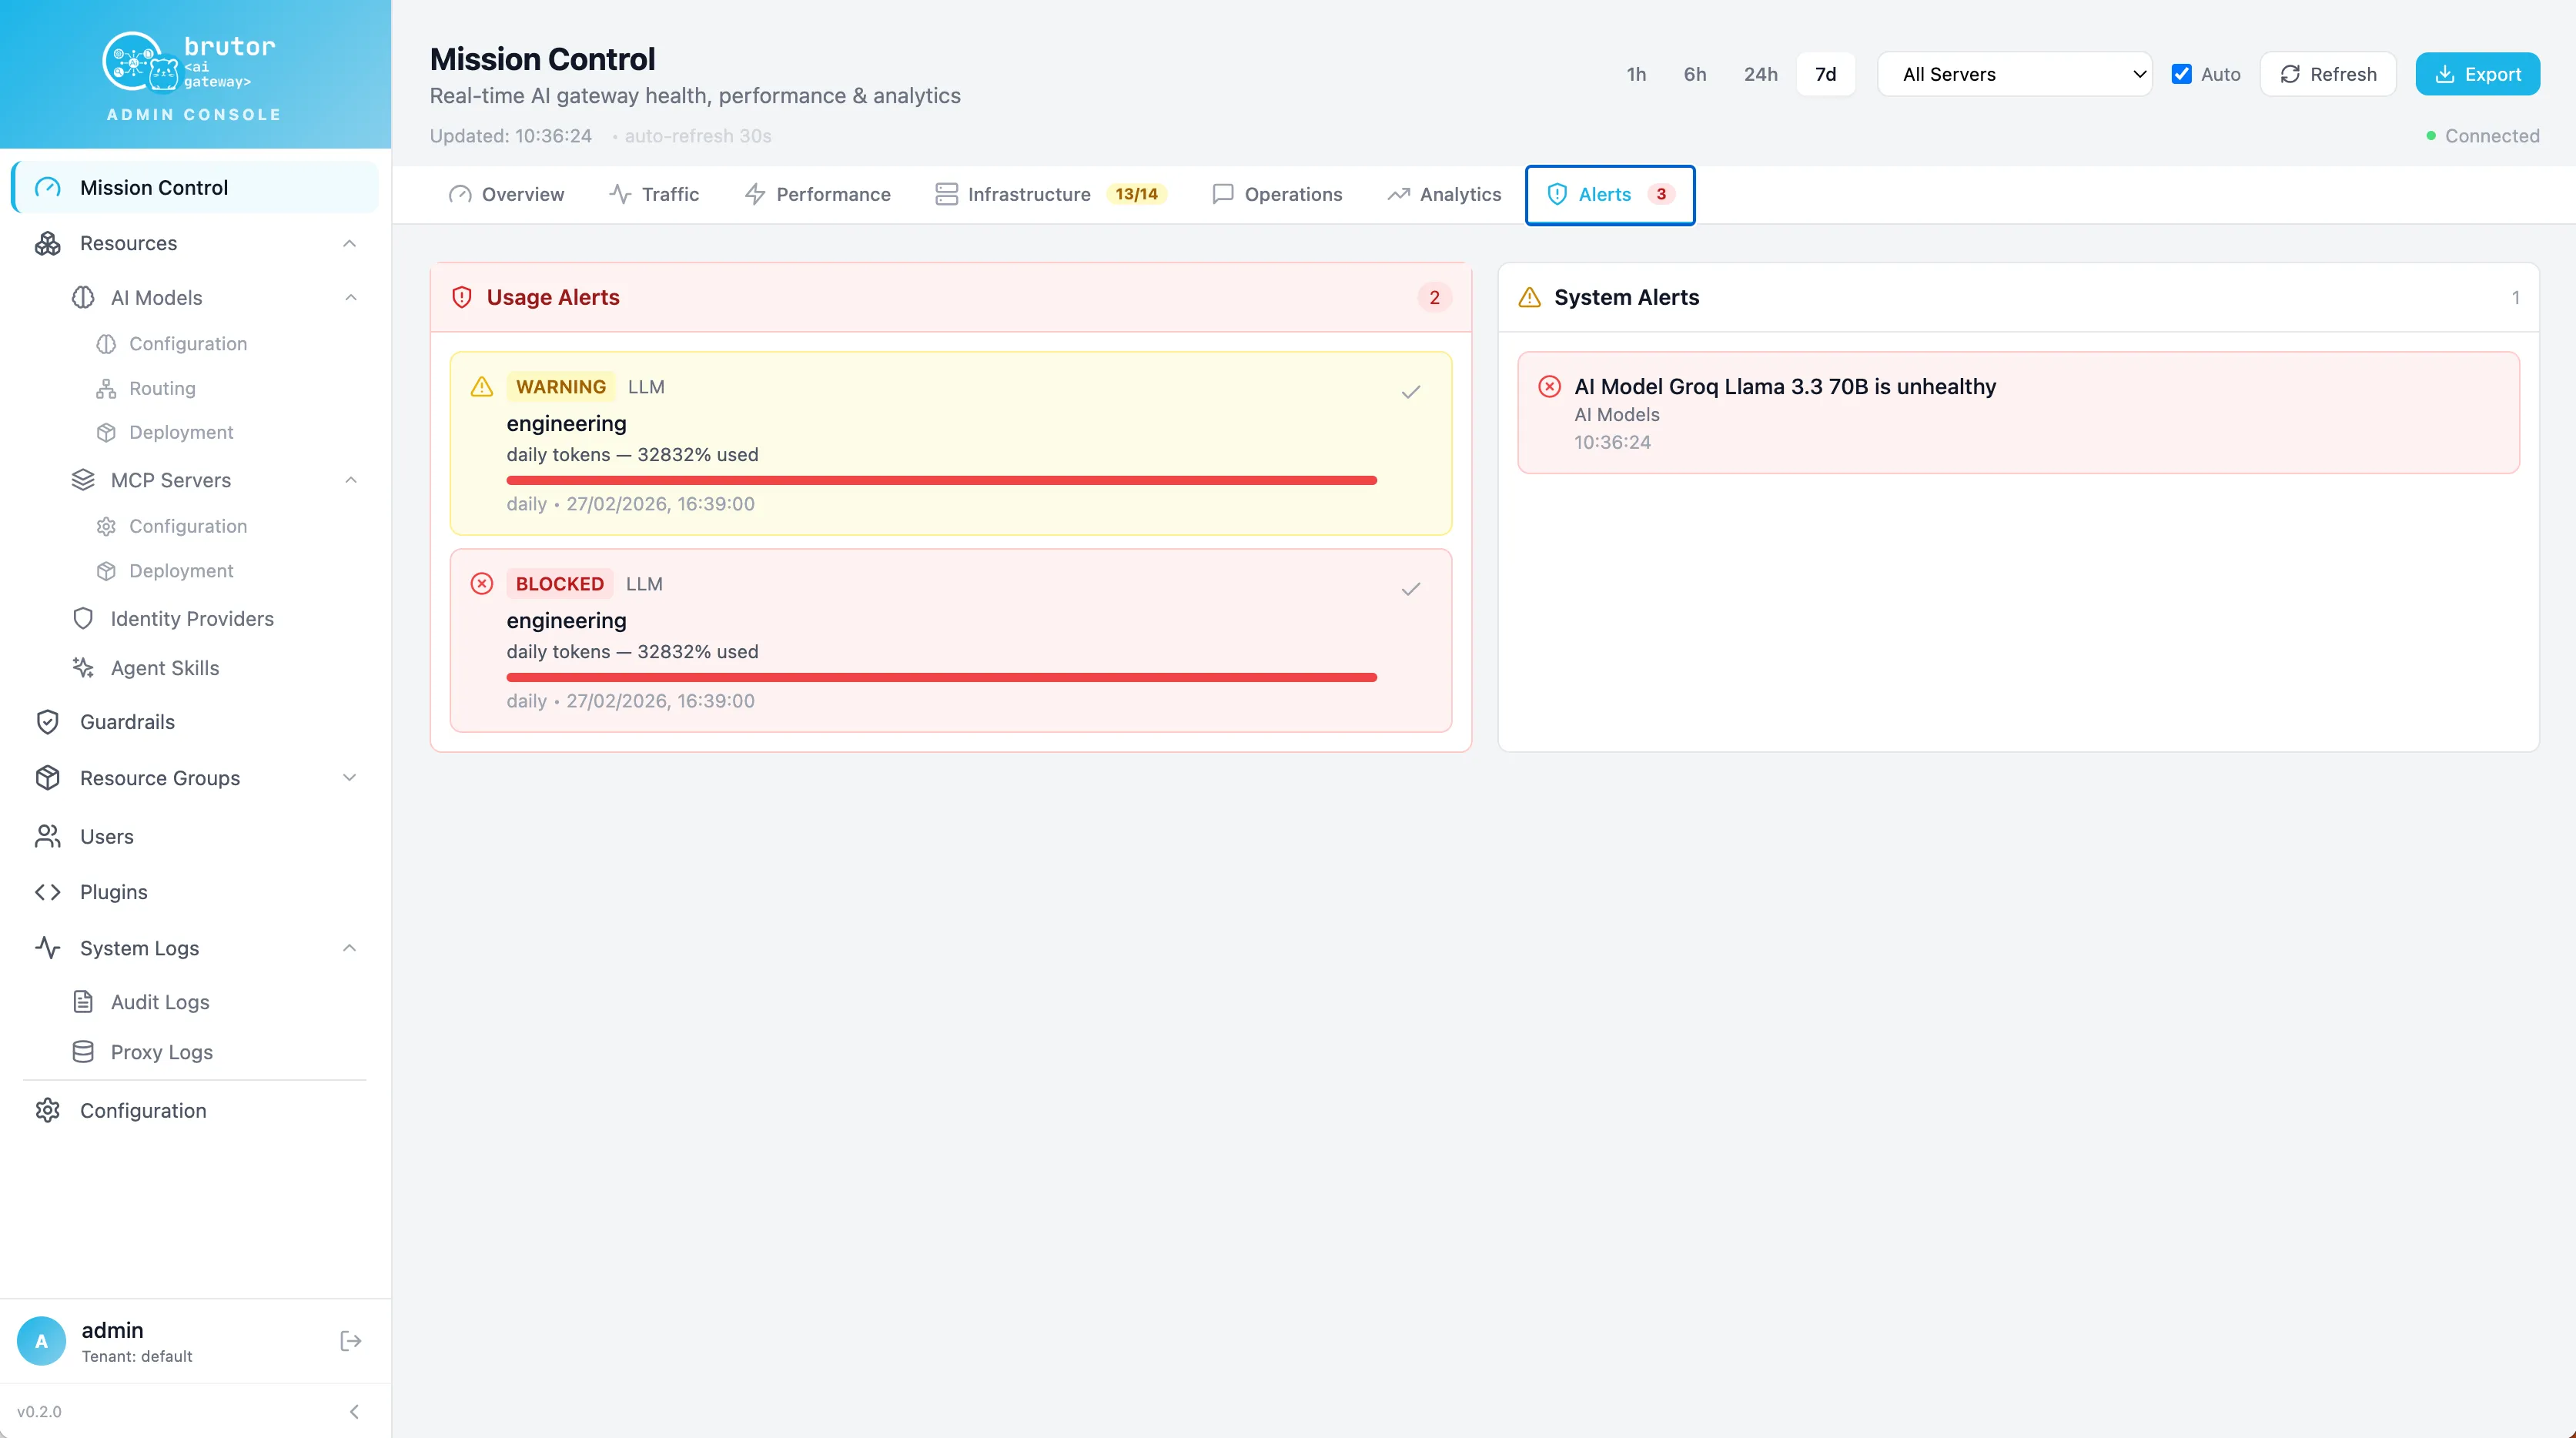
Alerts are configured per resource group (usage thresholds, budget warning percentages) — see alerts.
The three log families
Section titled “The three log families”Brutor writes three distinct records, and knowing which to open saves time:
| Log | One row per… | Use it for |
|---|---|---|
| Proxy logs | runtime request through the core proxy (LLM, MCP, A2A, skills — including blocked ones) | Debugging a specific call: status, latency, model, guardrail/limit outcome, correlation ID |
| Usage logs | metered unit of consumption (tokens, cost) | Cost attribution and quota accounting — this is the billing-grade ledger |
| Audit logs | admin/config action and governance decision | “Who changed what, and who was blocked from what” — the compliance trail |
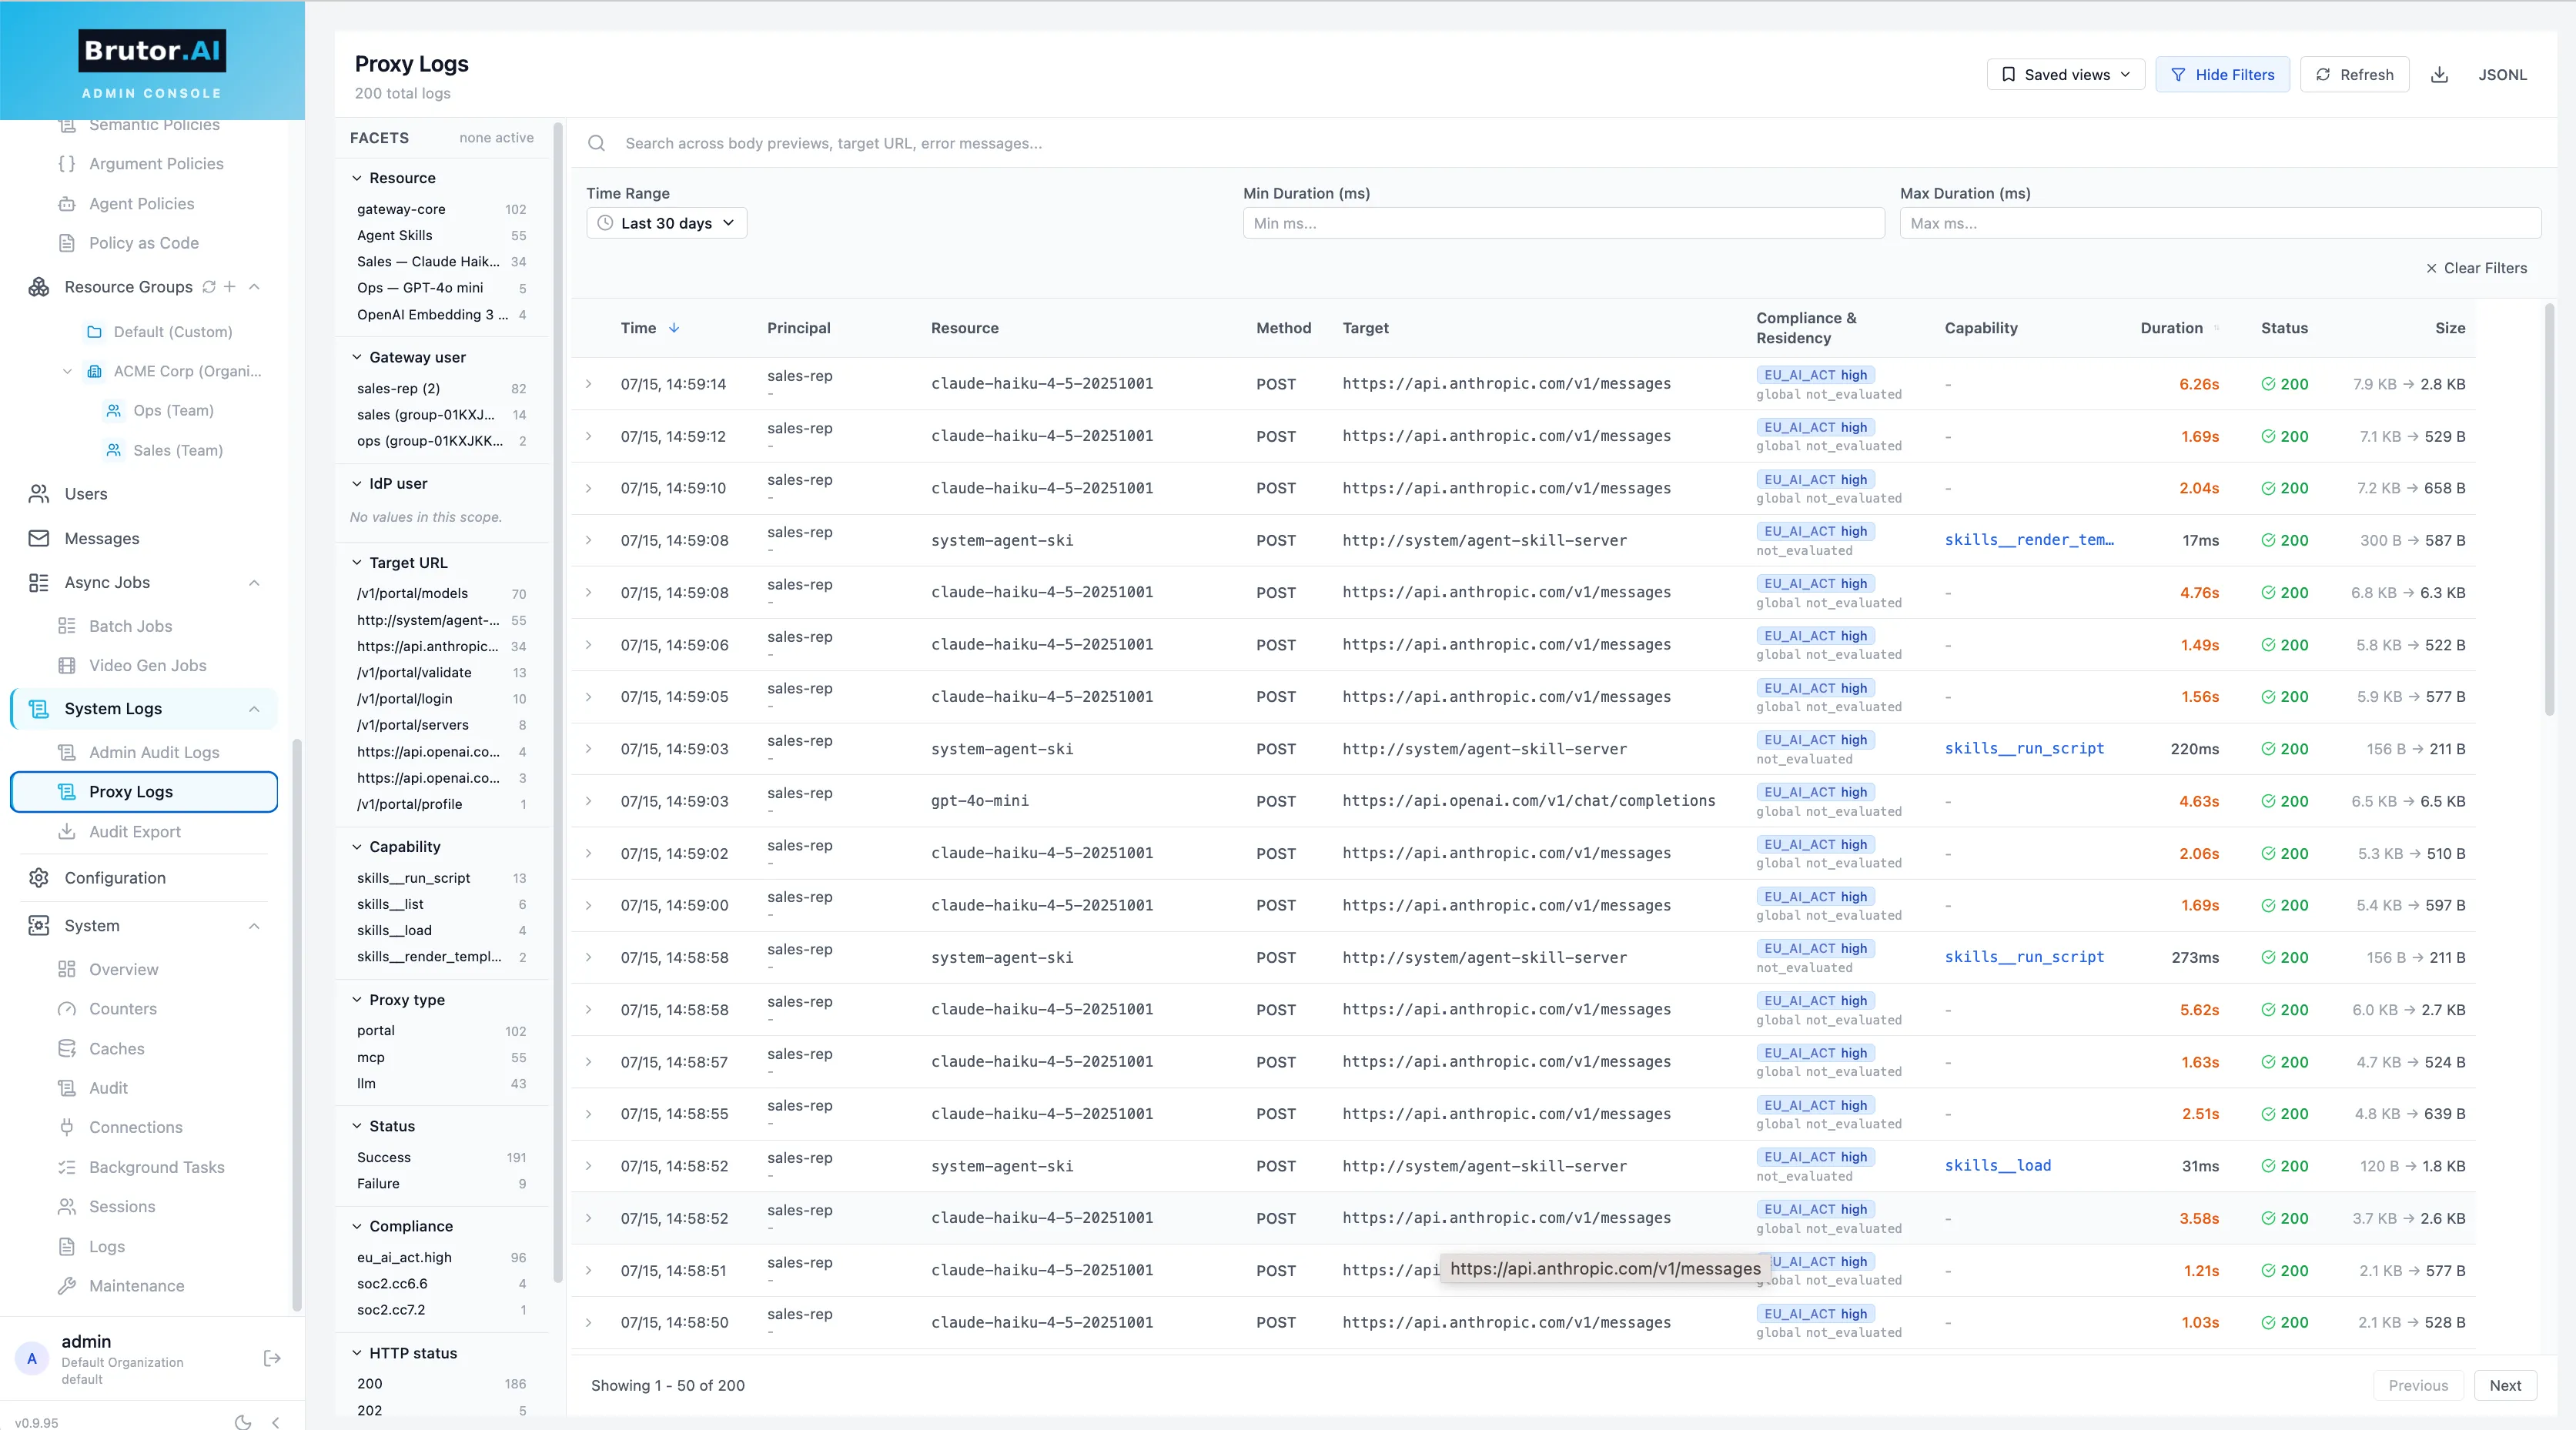
Every runtime response carries an X-Correlation-Id header; paste it into the proxy-log search to jump straight to the matching row. For LLM calls the logged request body is the outbound body — the request actually sent to the provider, after model resolution, default injection and format translation — which is what you want when debugging “what did the provider actually see?”.
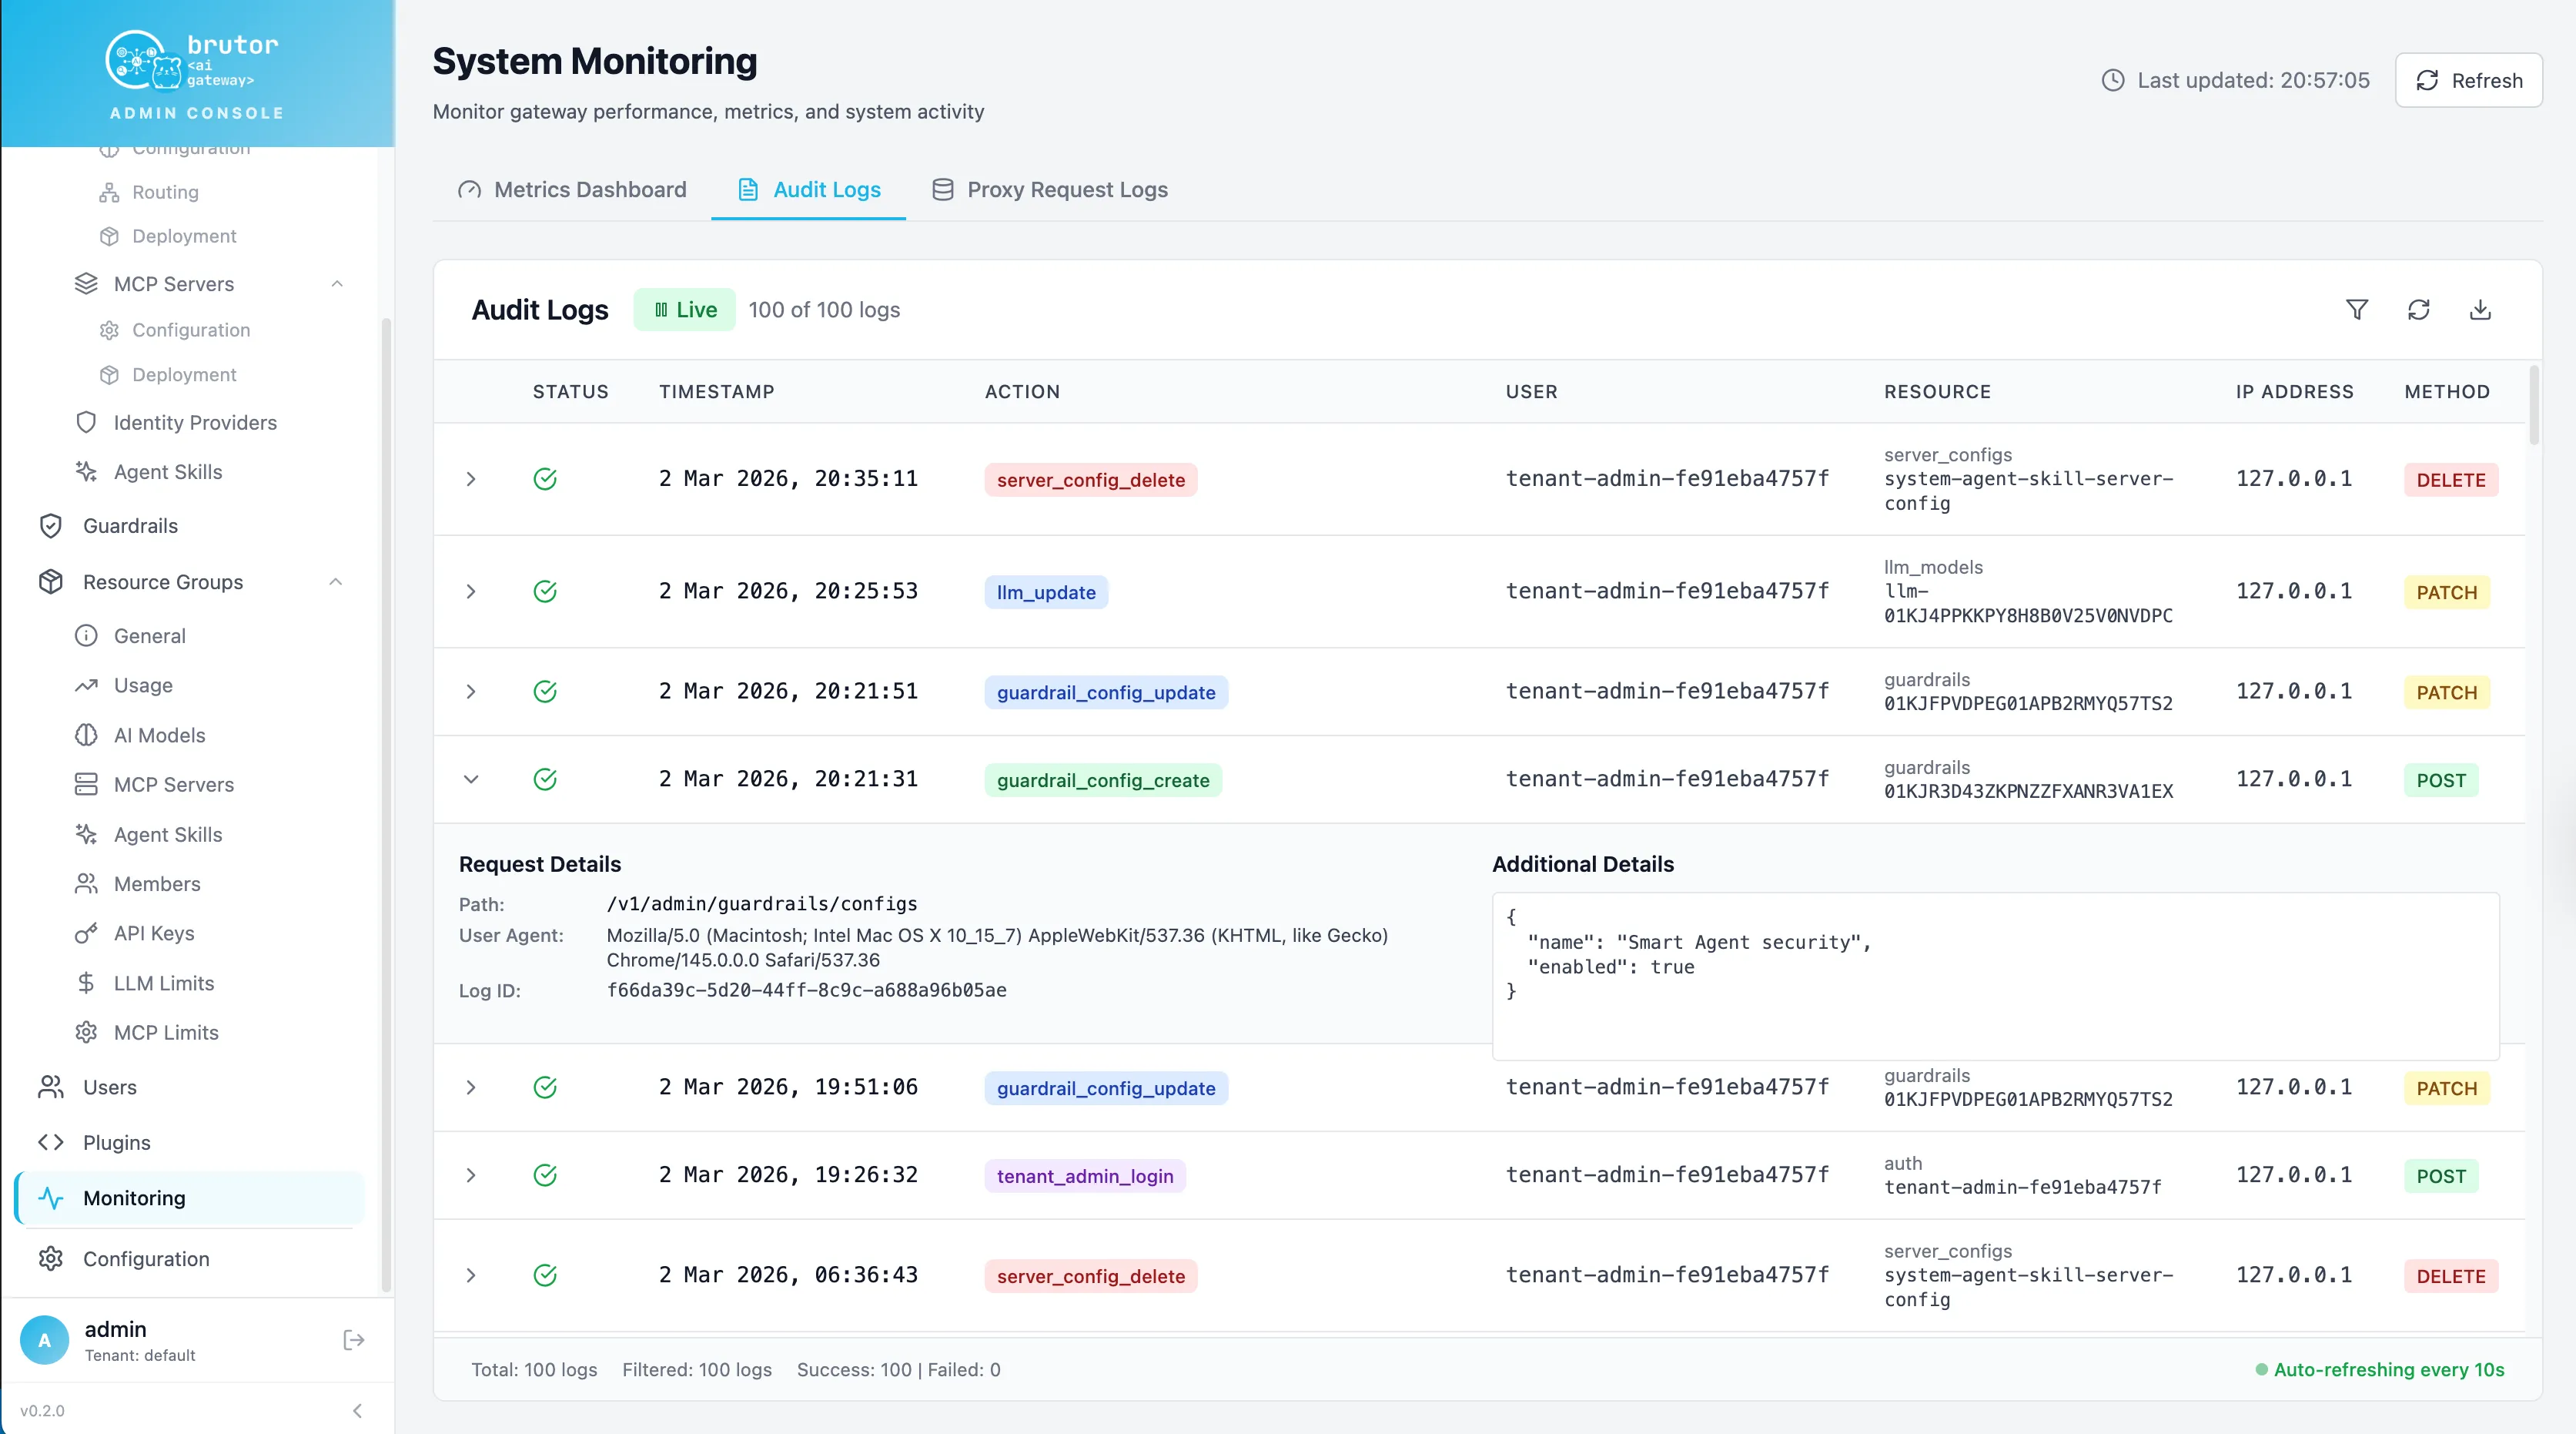
When tenant compliance frameworks are enabled (SOC 2, EU AI Act, HIPAA, GDPR Art. 30), audit rows carry the matching framework tags, and the compliance dashboard can export evidence — see compliance.
Telemetry writes are batched and asynchronous: under extreme backpressure the gateway sheds proxy-log and metric rows before it ever delays a request, but usage rows are never dropped. The /health endpoint’s background_writes.dropped counter tells you if shedding has occurred.
Usage-warning headers
Section titled “Usage-warning headers”You don’t have to poll a dashboard to know a budget is running out — the gateway tells the calling application. When a resource group crosses a limit’s warning threshold (by default 85% of a daily token limit, 80%/90% of a daily/monthly dollar budget), responses carry an X-Usage-Warning header:
X-Usage-Warning: Daily budget at 82%: $8.20 / $10.00Agents and portals can surface this to users before requests start failing with 429. See limits for the thresholds and what blocks versus warns.
Prometheus metrics
Section titled “Prometheus metrics”The core proxy exposes Prometheus metrics at GET /metrics on :8100 — request counts and latencies by proxy type and status, plus guardrail-hit counters. Scrape it like any other target:
scrape_configs: - job_name: brutor-gateway-core static_configs: - targets: ["gateway-core:8100"]The full metric reference lives in observability → metrics.
The dev observability stack
Section titled “The dev observability stack”The brutor-gateway-core repository’s Docker Compose ships a complete local observability stack alongside the proxy, pre-wired for development:
| Component | Port | Role |
|---|---|---|
| OpenTelemetry Collector | 4317 (OTLP gRPC) / 4318 (OTLP HTTP) / 8889 (Prometheus export) | Receives traces and metrics from the proxy |
| Prometheus | 9090 | Metrics store (30-day retention) |
| Loki | 3100 | Log aggregation |
| Grafana | 3010 | Dashboards over all of the above |
cd brutor-gateway-coredocker compose up -d# Grafana → http://localhost:3010This stack is for development and self-hosted setups; in production you’d point the OTLP exporters and the /metrics scrape at your existing observability platform.