
Mission Control
Mission Control is the operations home page of the Admin UI (http://localhost:3002 → Mission Control). It answers, at a glance: what’s flowing through the gateway, what is it costing, what did governance stop, and is anything on fire?
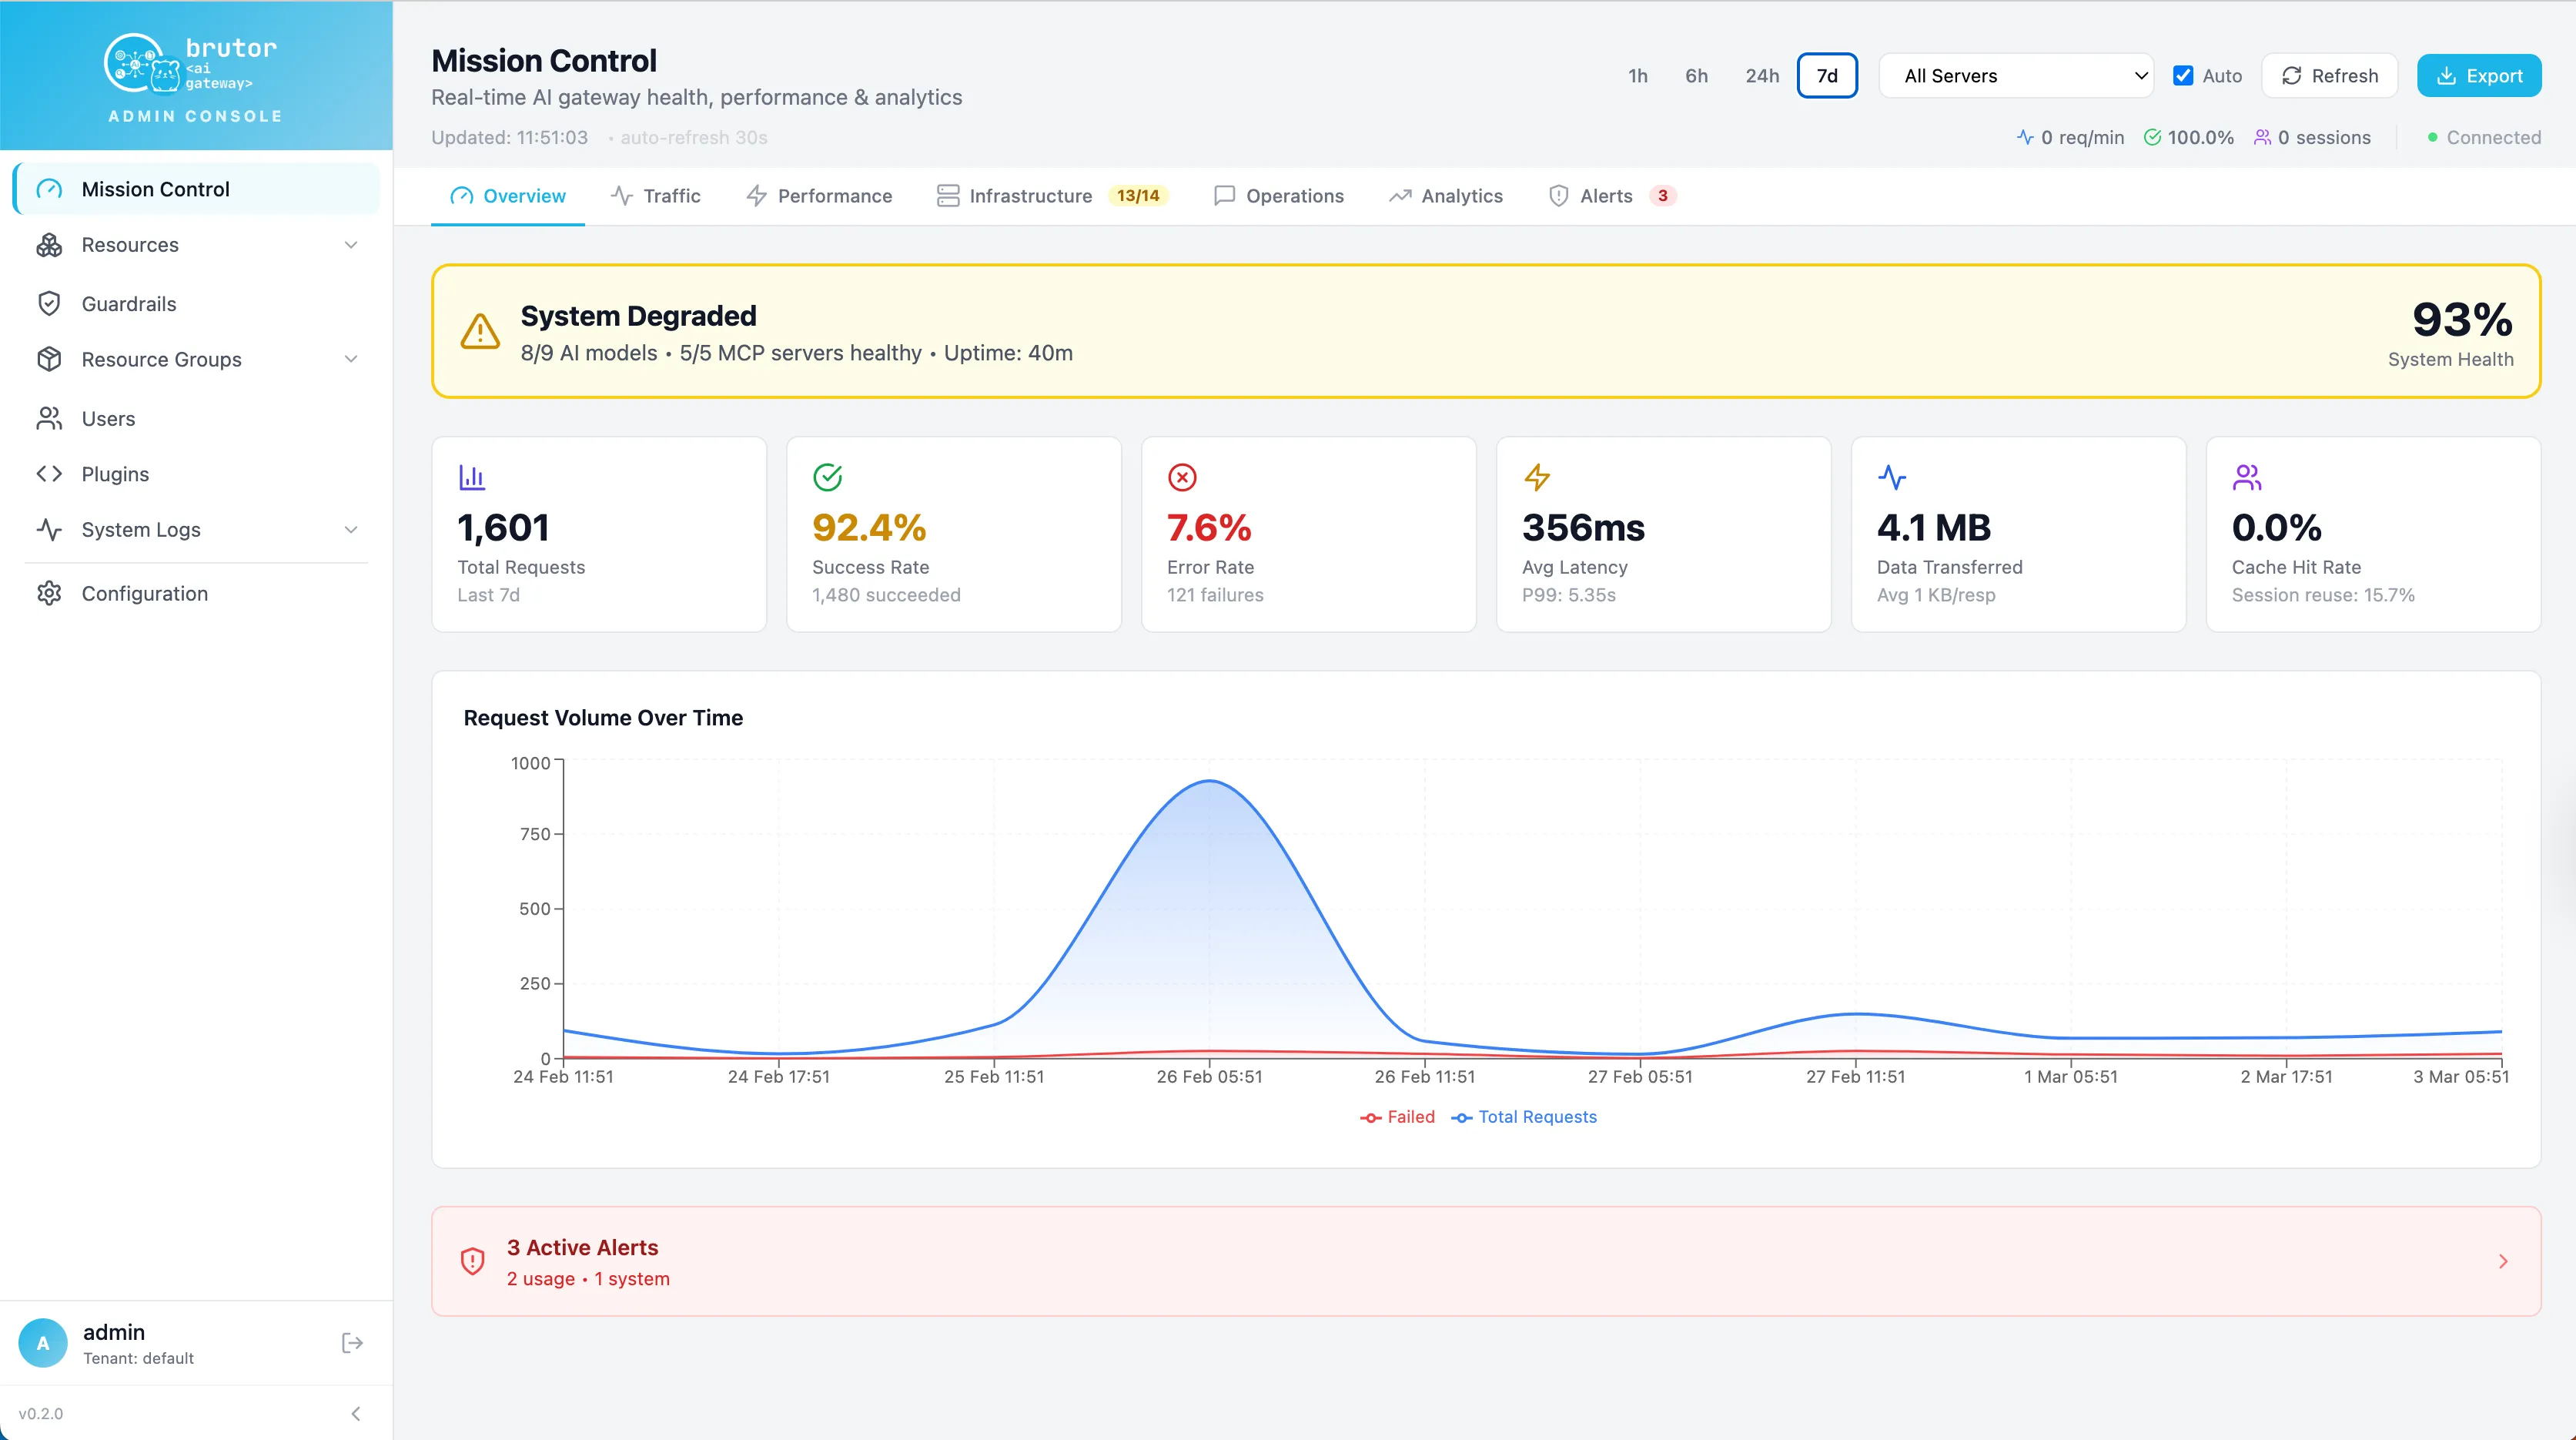
| Tab | What it shows |
|---|---|
| Overview | KPI cards (requests, tokens, cost, error rate, latency percentiles) + health summary — the 10-second status check |
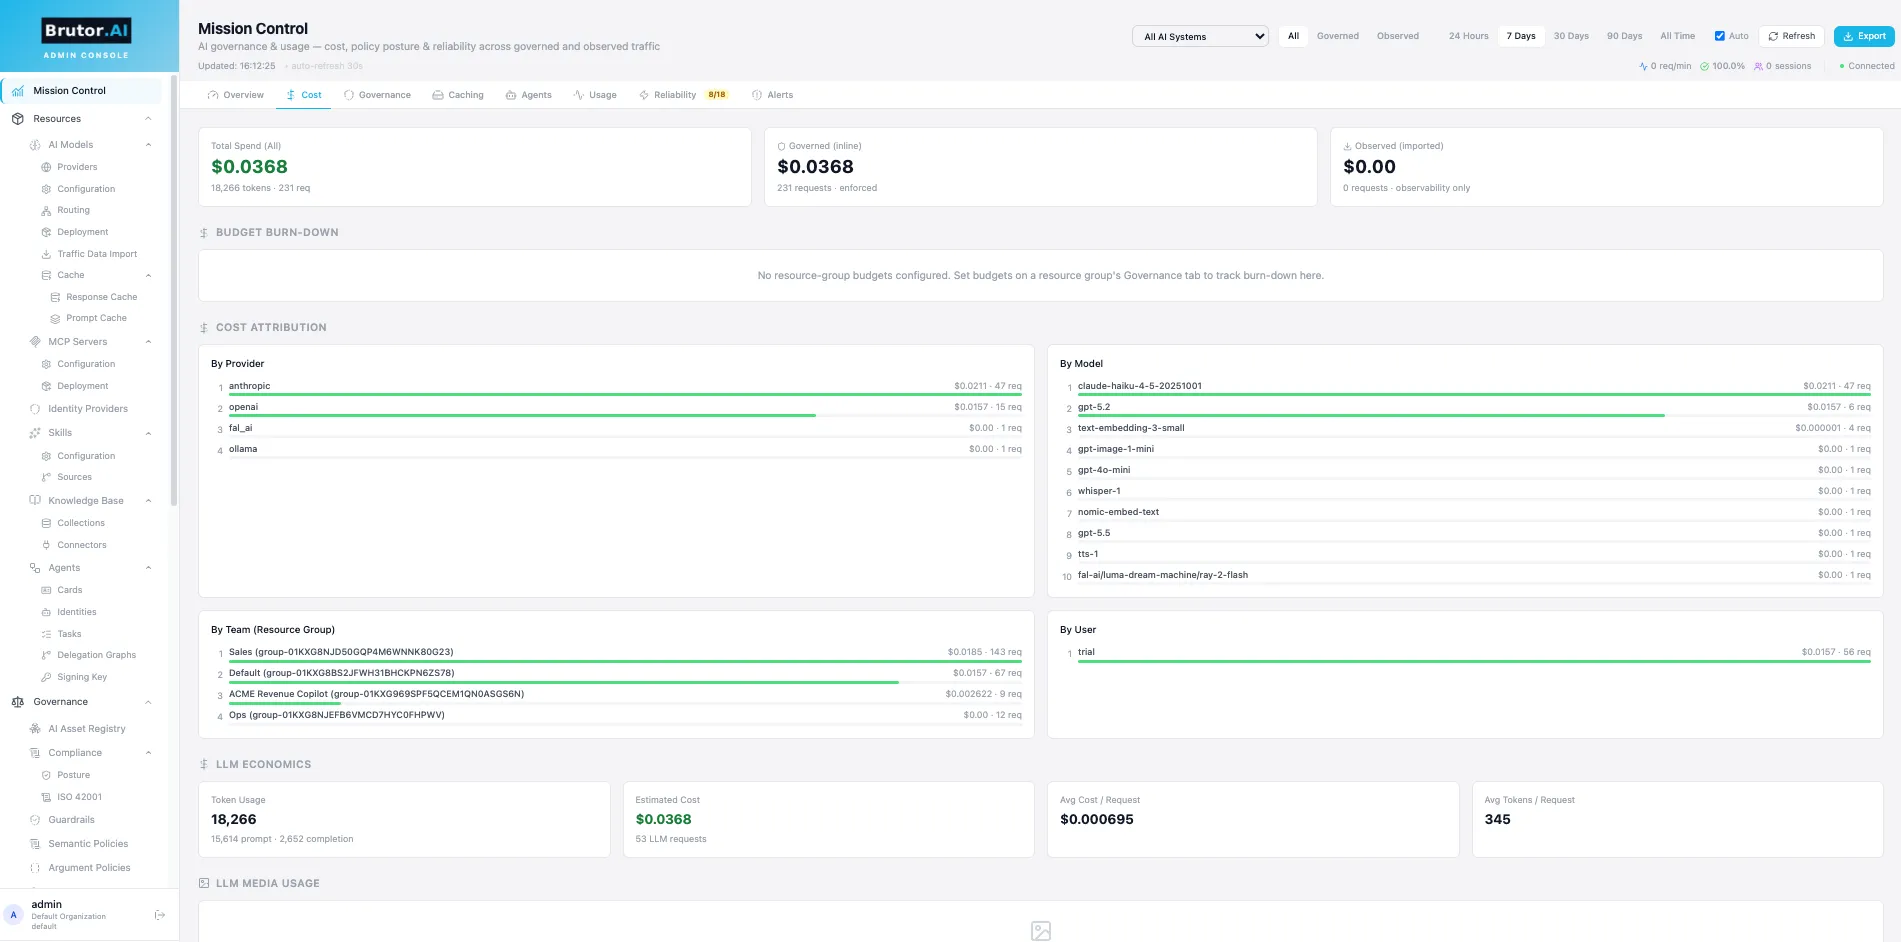
| Cost | FinOps view: spend and token breakdown by provider, model and team; budget burn-down vs configured limits with run-rate projection |
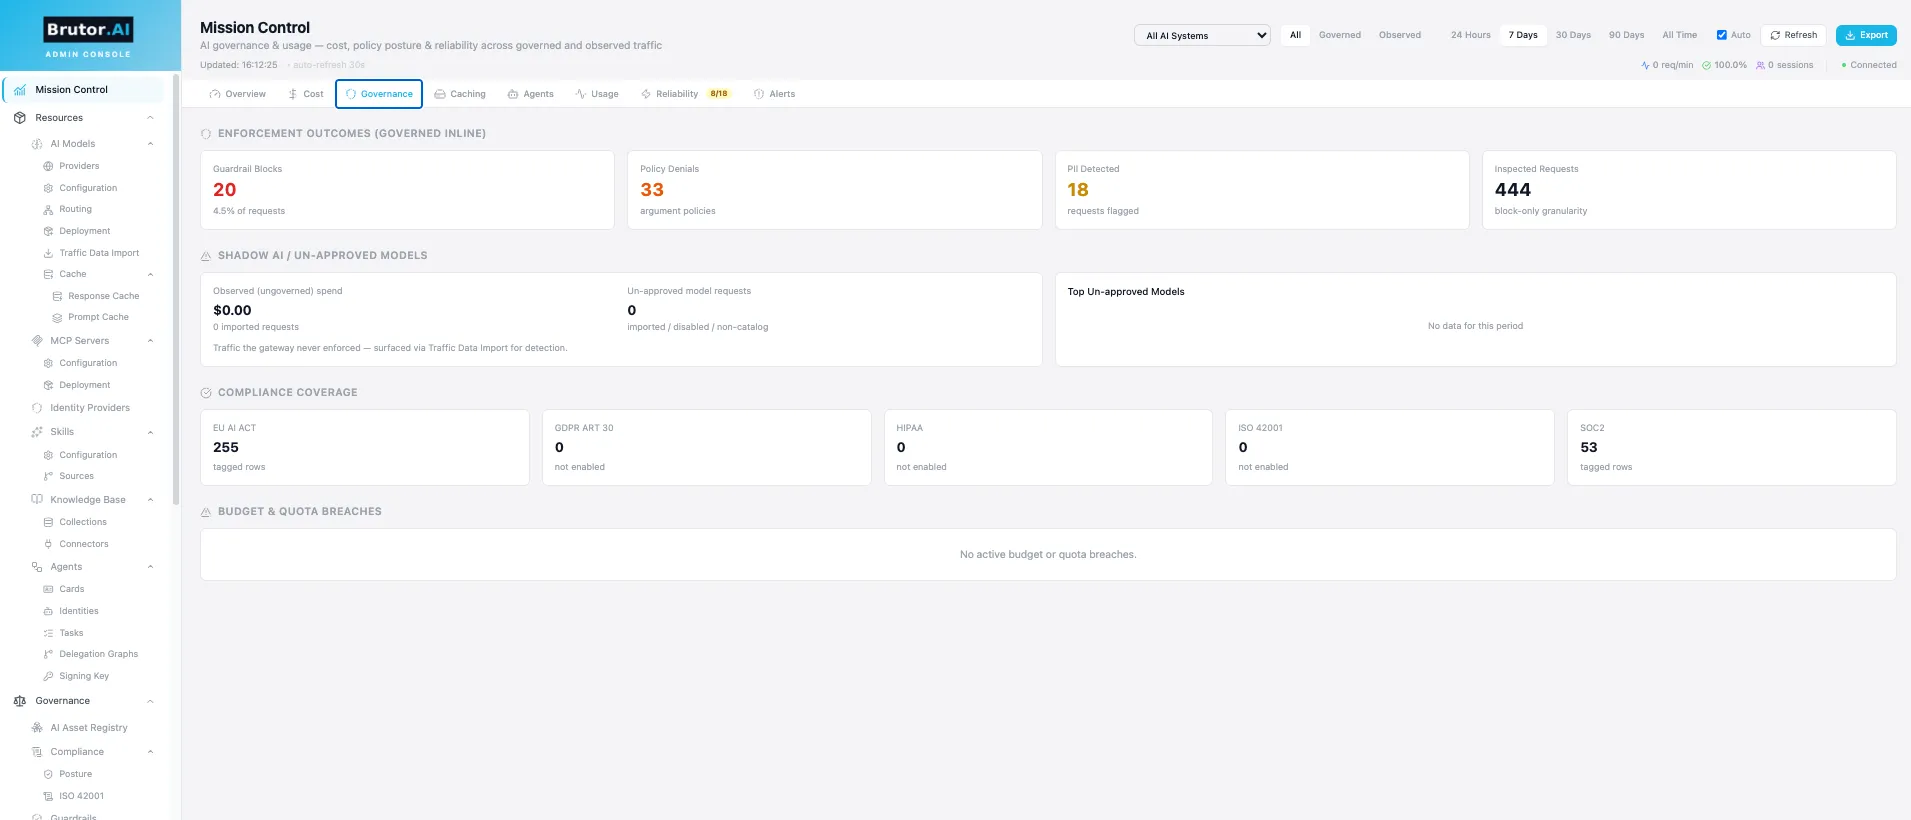
| Governance | Guardrail blocks, policy denials, PII detections, shadow-policy hits, shadow-AI signals — your enforcement posture over time |
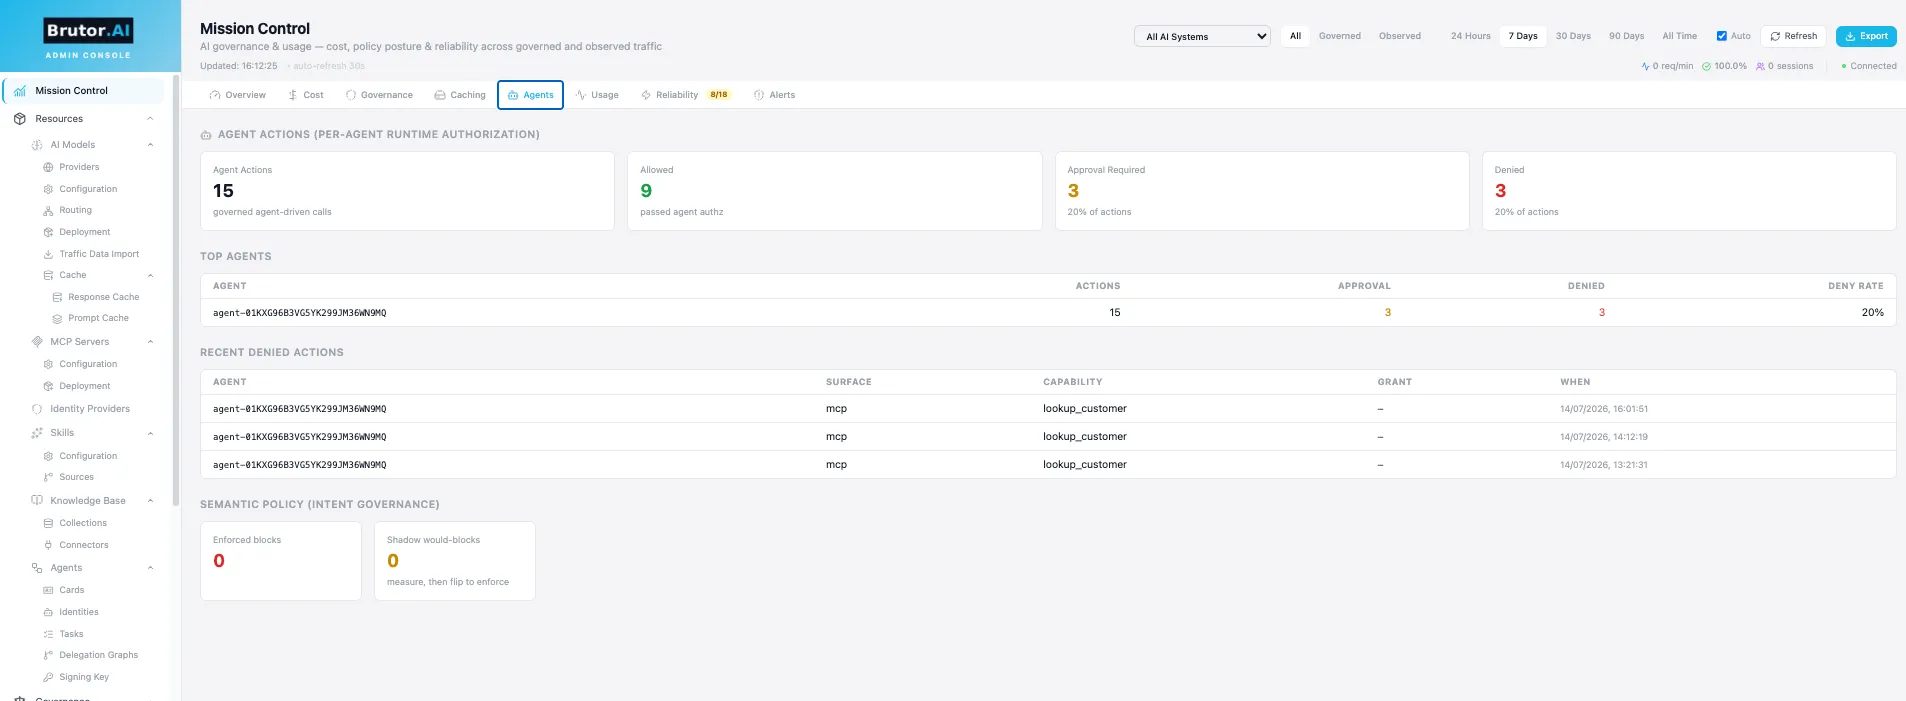
| Agents | Per-agent runtime activity and authorization decisions (allow / block / shadow) for agent workloads |
| Usage | Consumption drilldowns: volume time-series, per-group and per-user usage, quota utilization |
| Reliability | Latency percentiles (P50/P95/P99), error-rate time-series, hourly 7×24 traffic heatmap, per-server health |
| Alerts | Active usage alerts and metric-threshold alerts, with acknowledge actions |
Timespan selector
Section titled “Timespan selector”Every tab shares one timespan control, persisted per browser:
| Selection | period_hours |
|---|---|
| 24 hours | 24 |
| 7 days | 168 |
| 30 days | 720 |
| 90 days | 2160 |
| All Time | 0 (no lower time bound) |
The Governed / Observed / All plane toggle
Section titled “The Governed / Observed / All plane toggle”Brutor tracks two planes of AI traffic:
- Governed — requests that flowed through the gateway inline: enforced, guardrailed, metered in real time.
- Observed — telemetry Brutor learned about out of band: imported vendor usage data (Traffic Data Import) and discovered assets. Visible for cost and inventory purposes, but not enforced.
The toggle filters every chart via the plane query parameter (governed | observed | omitted = all), which maps to the source column on metrics and usage rows (gateway vs import:*).
Reliability views
Section titled “Reliability views”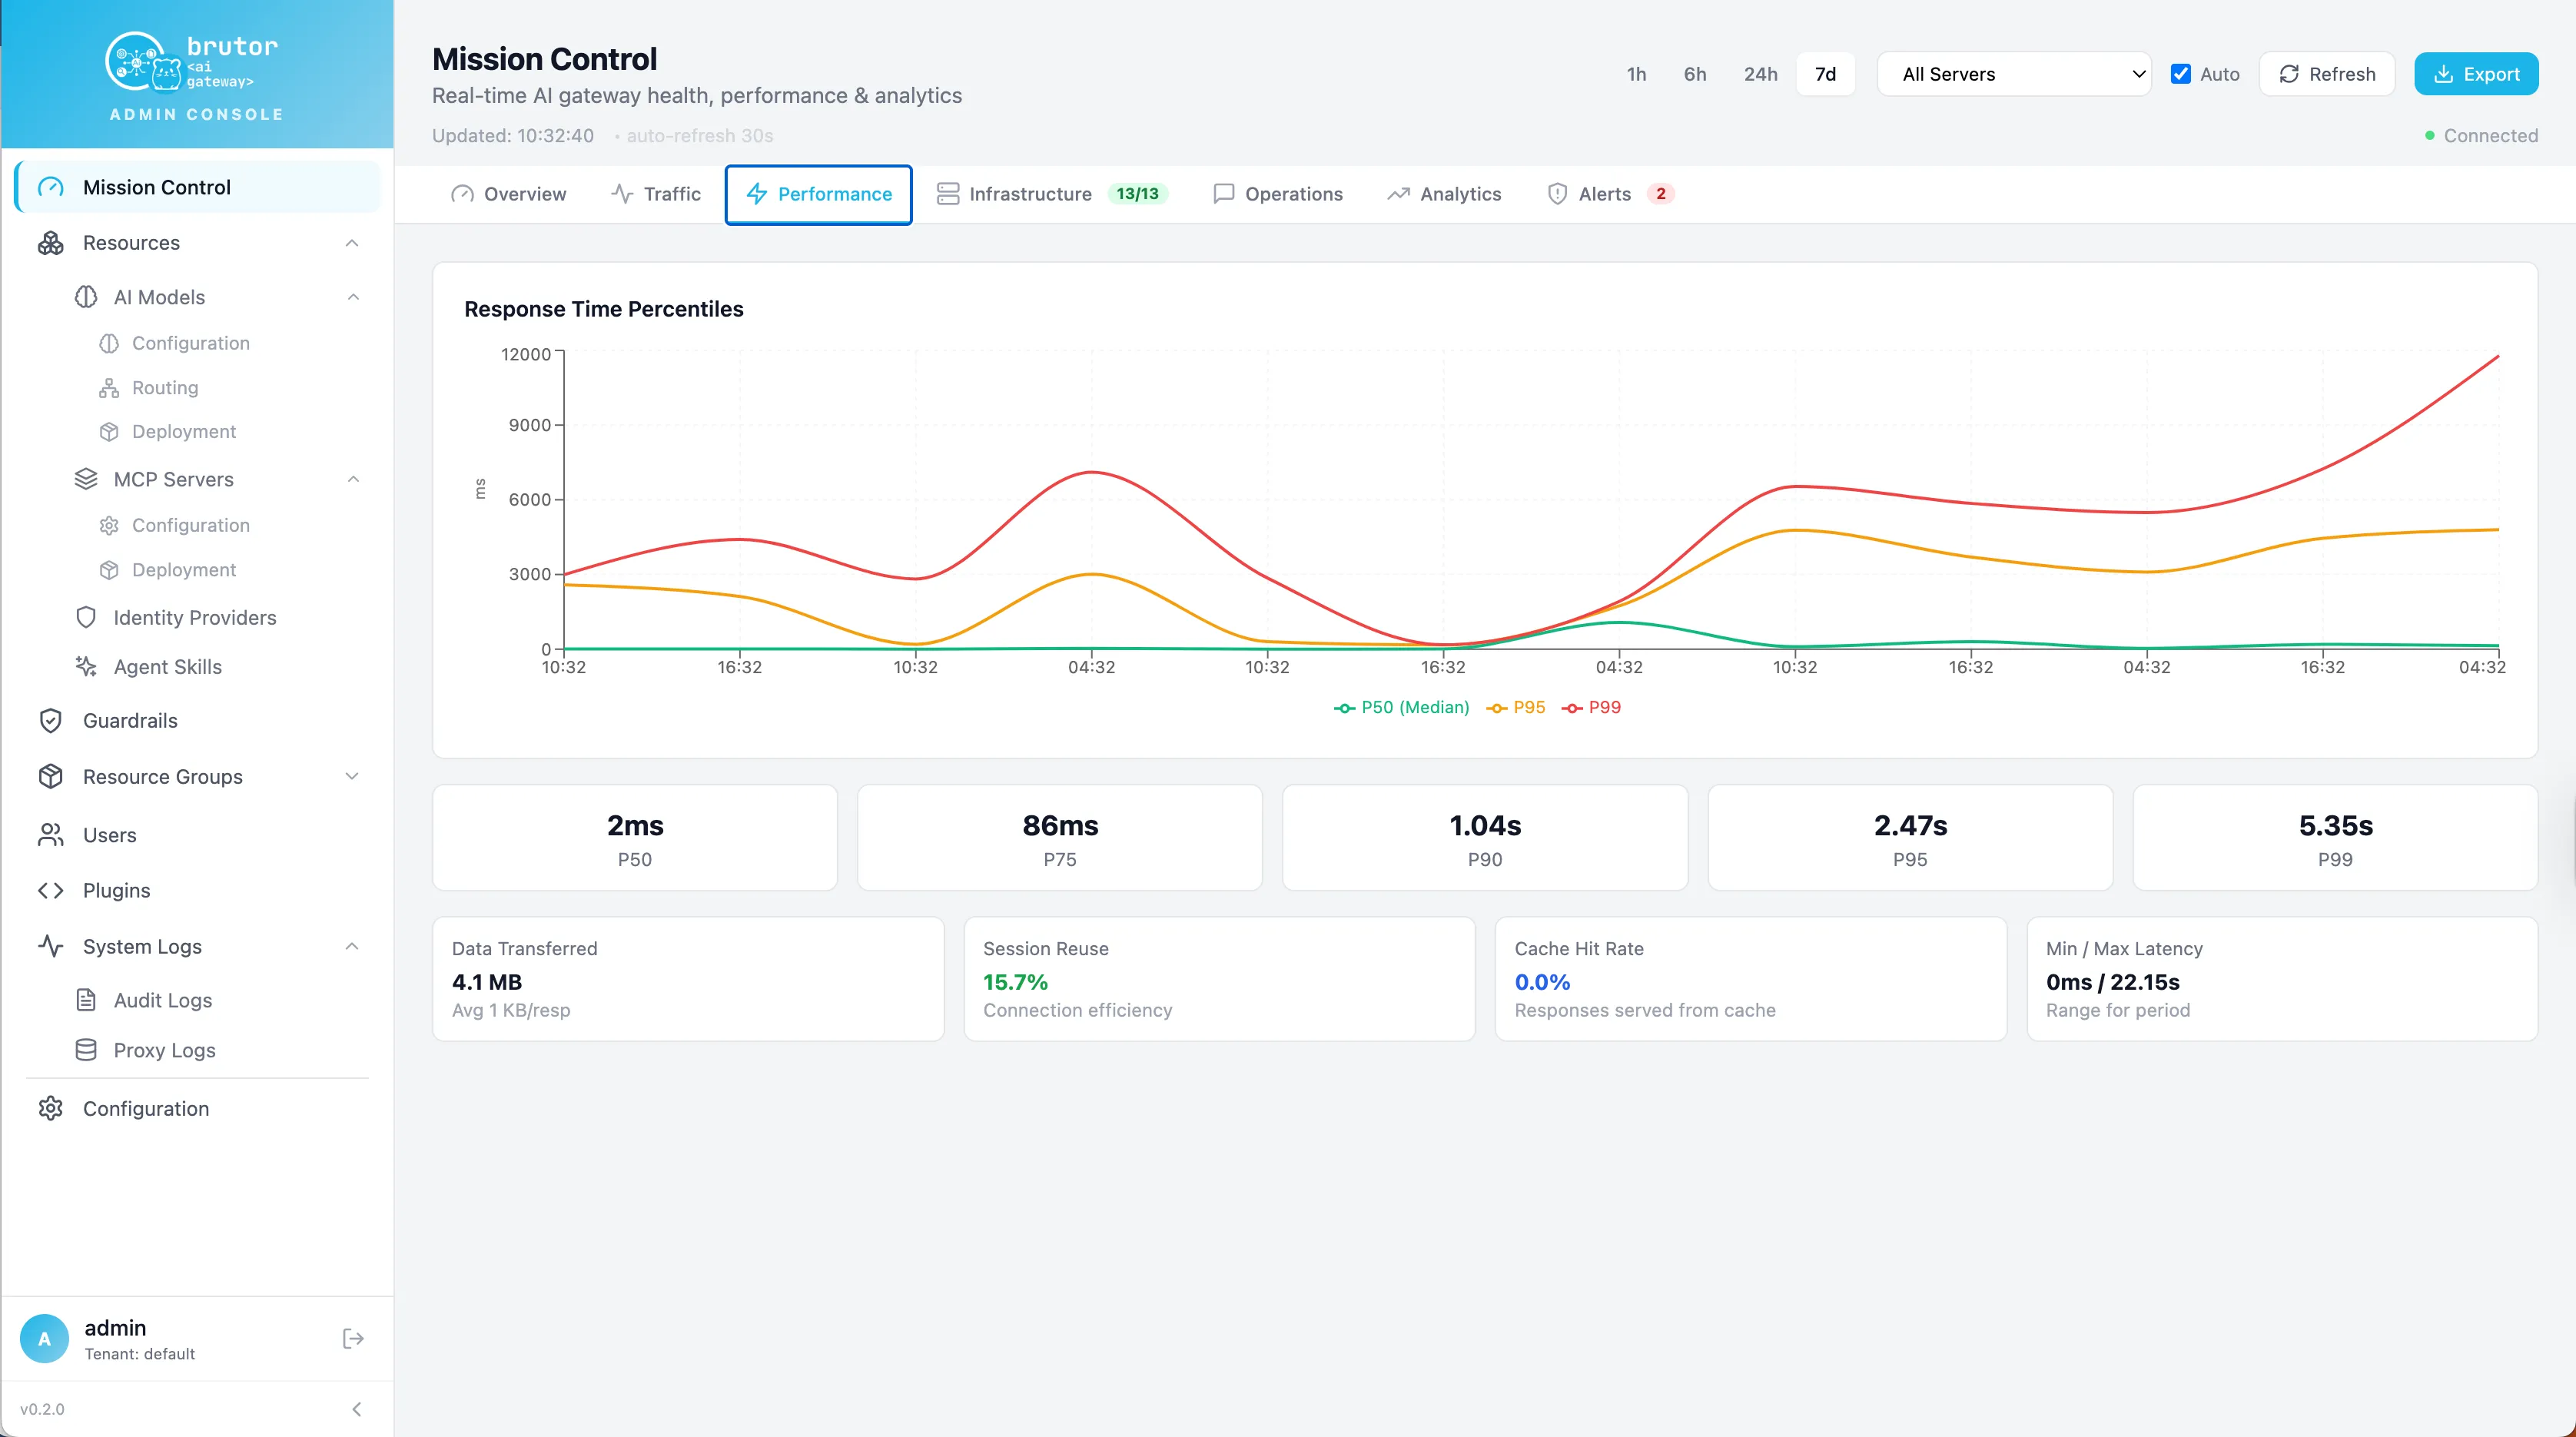
The Reliability tab’s latency and error-rate series come with configurable intervals, and the per-server status strip shows health, latency, and request rate over the last five minutes for each registered MCP server and model backend.
Per-resource-group drilldowns
Section titled “Per-resource-group drilldowns”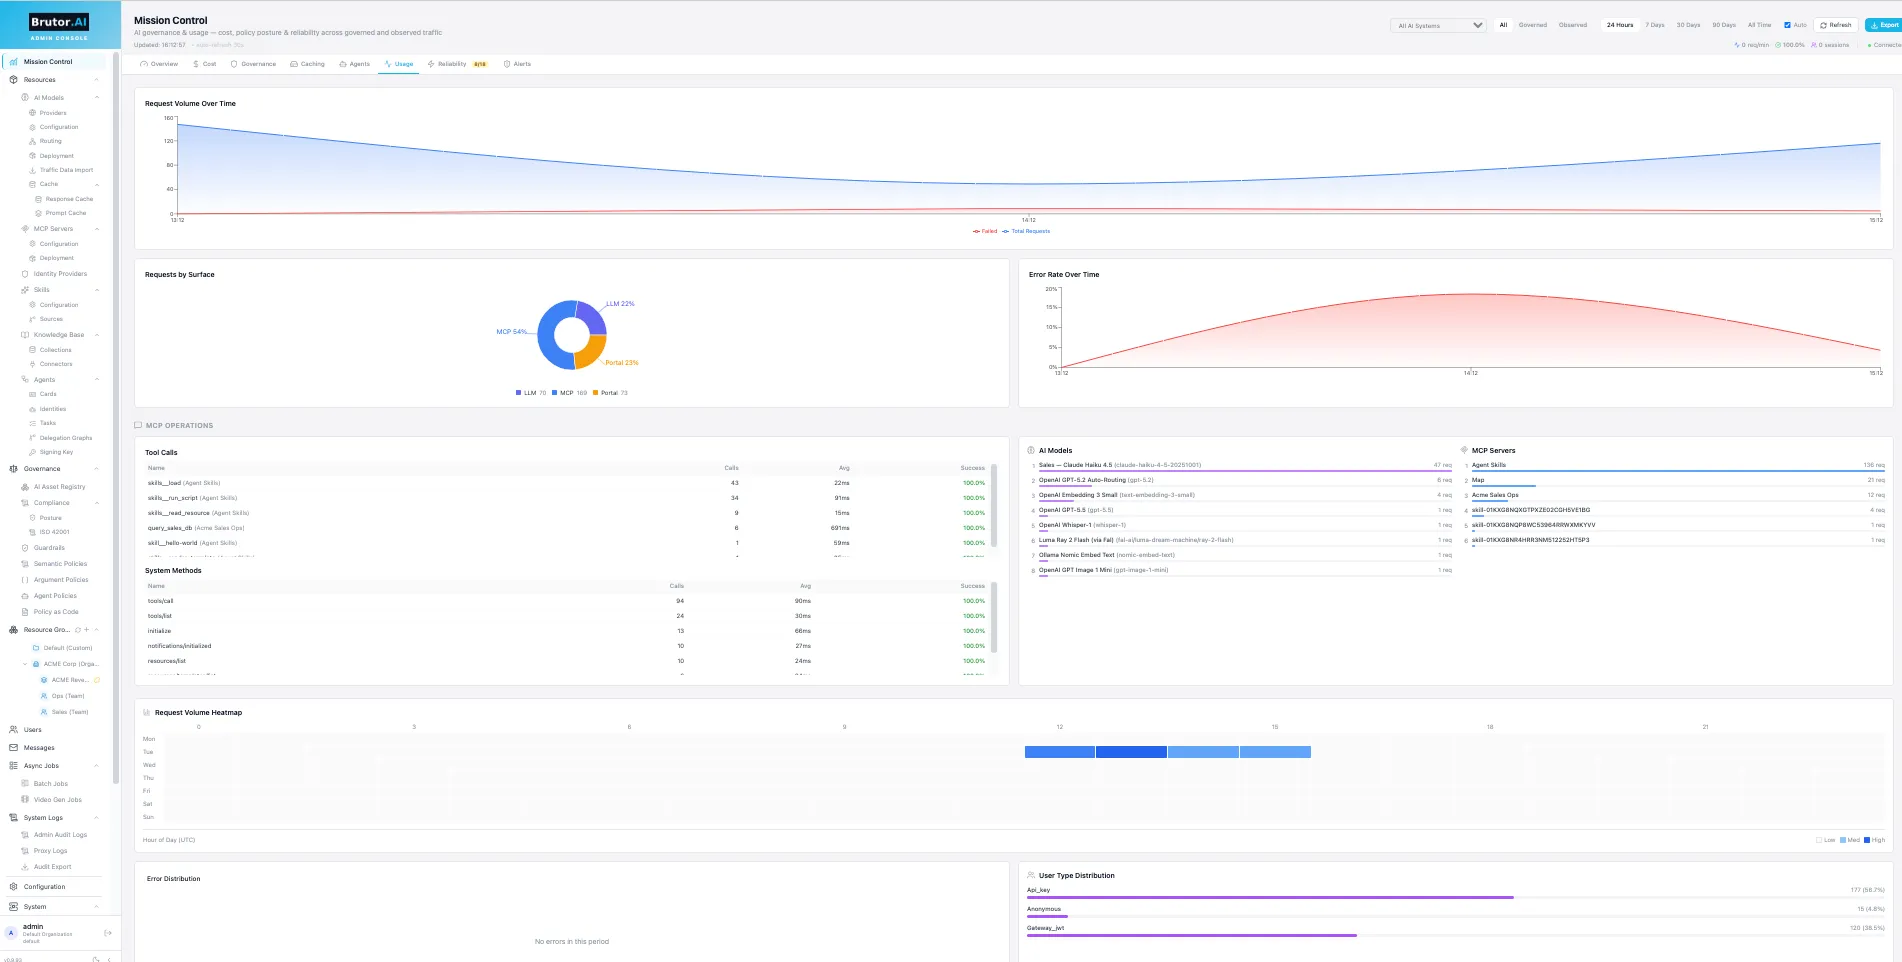
Mission Control aggregates the tenant; for a single team’s picture, open the resource group’s own Usage tab (backed by GET /v1/admin/resource-groups/{id}/usage) — same KPIs scoped to that group and its subtree, next to the group’s limits and usage alerts.
The API behind the dashboard
Section titled “The API behind the dashboard”Everything on screen is a Control Plane endpoint you can script against (all under /v1/admin/metrics, bearer-authenticated, period_hours + plane params as above):
| Endpoint | Backs |
|---|---|
GET /dashboard |
Overview KPI strip + health summary |
GET /performance |
Aggregate performance metrics |
GET /real-time?last_minutes=5 |
Live throughput / success rate / error spikes |
GET /cost/breakdown?top_n=10 |
Cost tab: spend by provider/model/team |
GET /cost/budgets |
Budget burn-down + run-rate projection |
GET /governance/posture |
Governance tab counters |
GET /agents/activity |
Agents tab |
GET /timeseries/requests · /timeseries/latency · /timeseries/error-rate |
Charts (with interval_minutes) |
GET /heatmap/hourly?days=7 |
7×24 traffic heatmap |
GET /usage?group_by=day |
Billing/quota usage series |
GET /servers/status |
Per-server health strip |
GET /alerts?severity=high |
Metric-threshold alerts |
GET /export?format=csv |
Bulk metric export |
Example — this week’s cost breakdown, governed traffic only:
curl "http://localhost:5050/v1/admin/metrics/cost/breakdown?period_hours=168&plane=governed&top_n=5" \ -H "Authorization: Bearer $ADMIN_TOKEN"Related pages
Section titled “Related pages”- Logs & audit trail — drill from a chart to the underlying requests
- Metrics & Grafana — the Prometheus side, for your own dashboards and alerting
- Usage alerts — what feeds the Alerts tab