
Usage Alerts
Usage alerts are the early-warning side of budgets, quotas & rate limits. When a resource group’s consumption crosses a warning threshold — or a limit actually stops traffic — Brutor raises an alert that operators and portal users can see and acknowledge.
Where alerts come from
Section titled “Where alerts come from”Alerts are generated from the thresholds you configure on the group’s limit documents. Each family (budget, tokens, requests, MCP frequency) carries daily_warning_percent / monthly_warning_percent fields; hard limits raise their own alerts when they trip:
alert_type |
Raised when |
|---|---|
warning |
Utilization crosses a configured *_warning_percent threshold |
hard_stop |
A blocking limit trips — token/request quota exhausted, throughput cooldown, or a $-budget with hard_stop: true |
resumed |
Traffic is flowing again after a hard stop (window rolled over or limit raised) |
Each alert records the metric it fired on (e.g. daily_tokens, monthly_budget, daily_requests, daily_mcp_calls), the period (daily / monthly), the configured threshold_pct, and the actual utilization_pct at firing time. Alert lifecycle status is active → acknowledged → resolved.
Configuring thresholds
Section titled “Configuring thresholds”Set the warning percentages where the limits live — the group’s LLM Limits tab or the llm-global-limits PATCH:
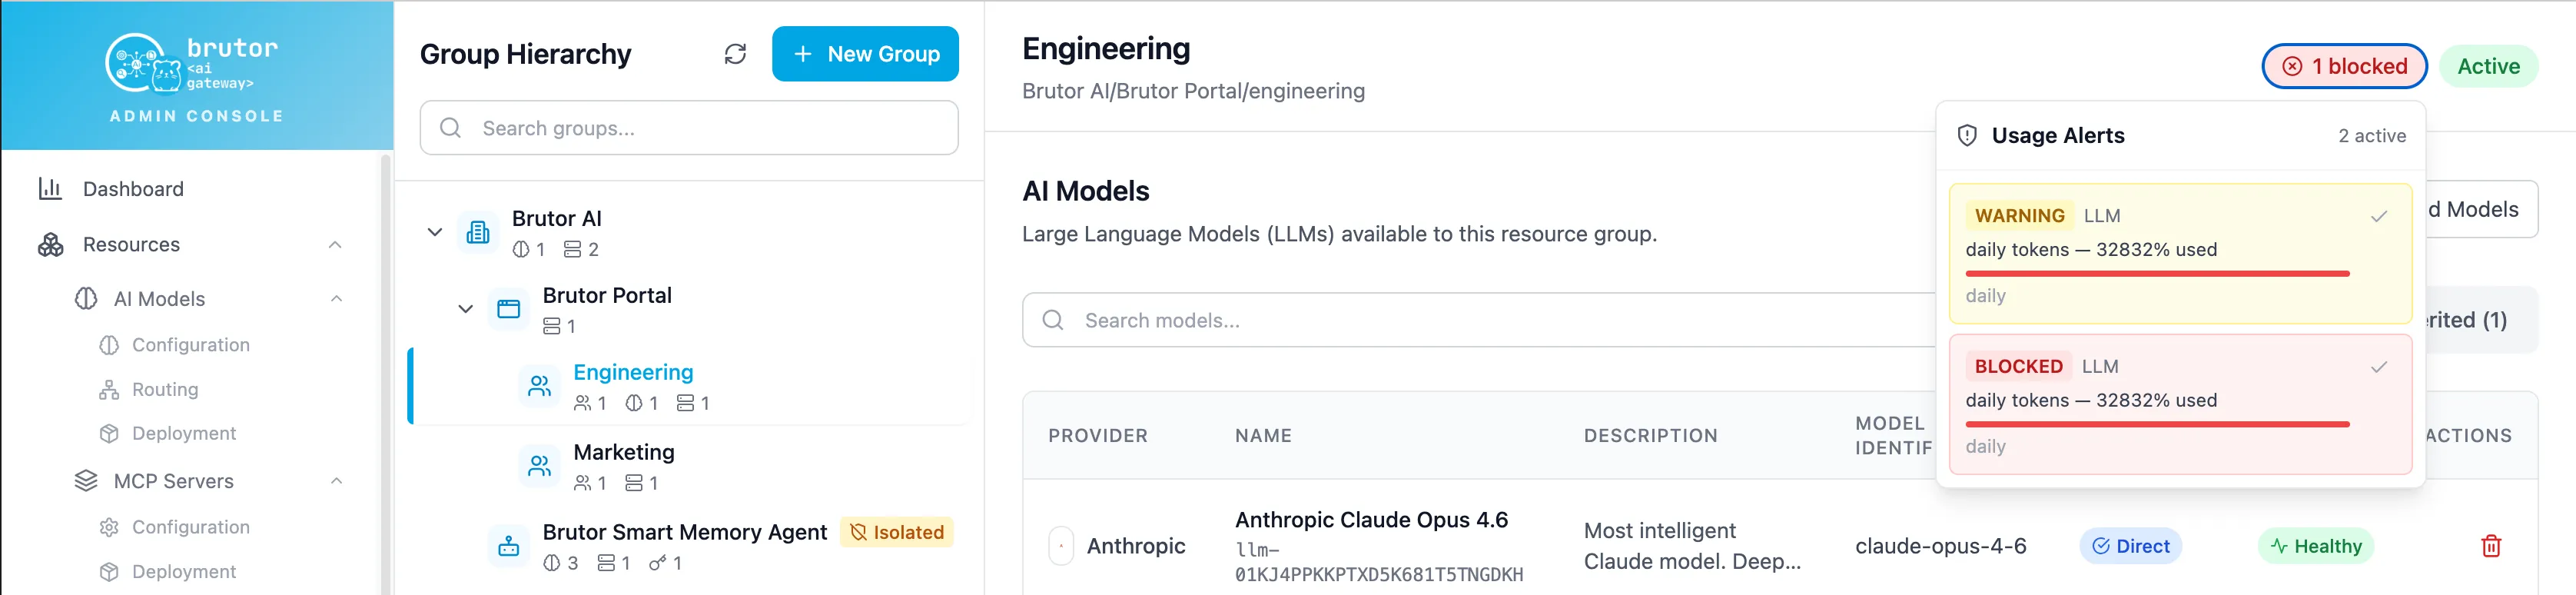
curl -X PATCH http://localhost:5050/v1/admin/resource-groups/{group_id}/llm-global-limits \ -H "Authorization: Bearer $ADMIN_TOKEN" \ -H "Content-Type: application/json" \ -d '{ "llm_global_limits": { "budget": { "monthly_limit_usd": 1000.0, "monthly_warning_percent": 80, "hard_stop": false }, "tokens": { "daily_limit": 2000000, "daily_warning_percent": 90 } } }'The group’s Usage Alerts tab shows everything the group has raised:
Where alerts surface
Section titled “Where alerts surface”Mission Control → Alerts
Section titled “Mission Control → Alerts”The Alerts tab in Mission Control aggregates active usage alerts across all groups, alongside metric-threshold alerts (error rate / latency, from GET /v1/admin/metrics/alerts):
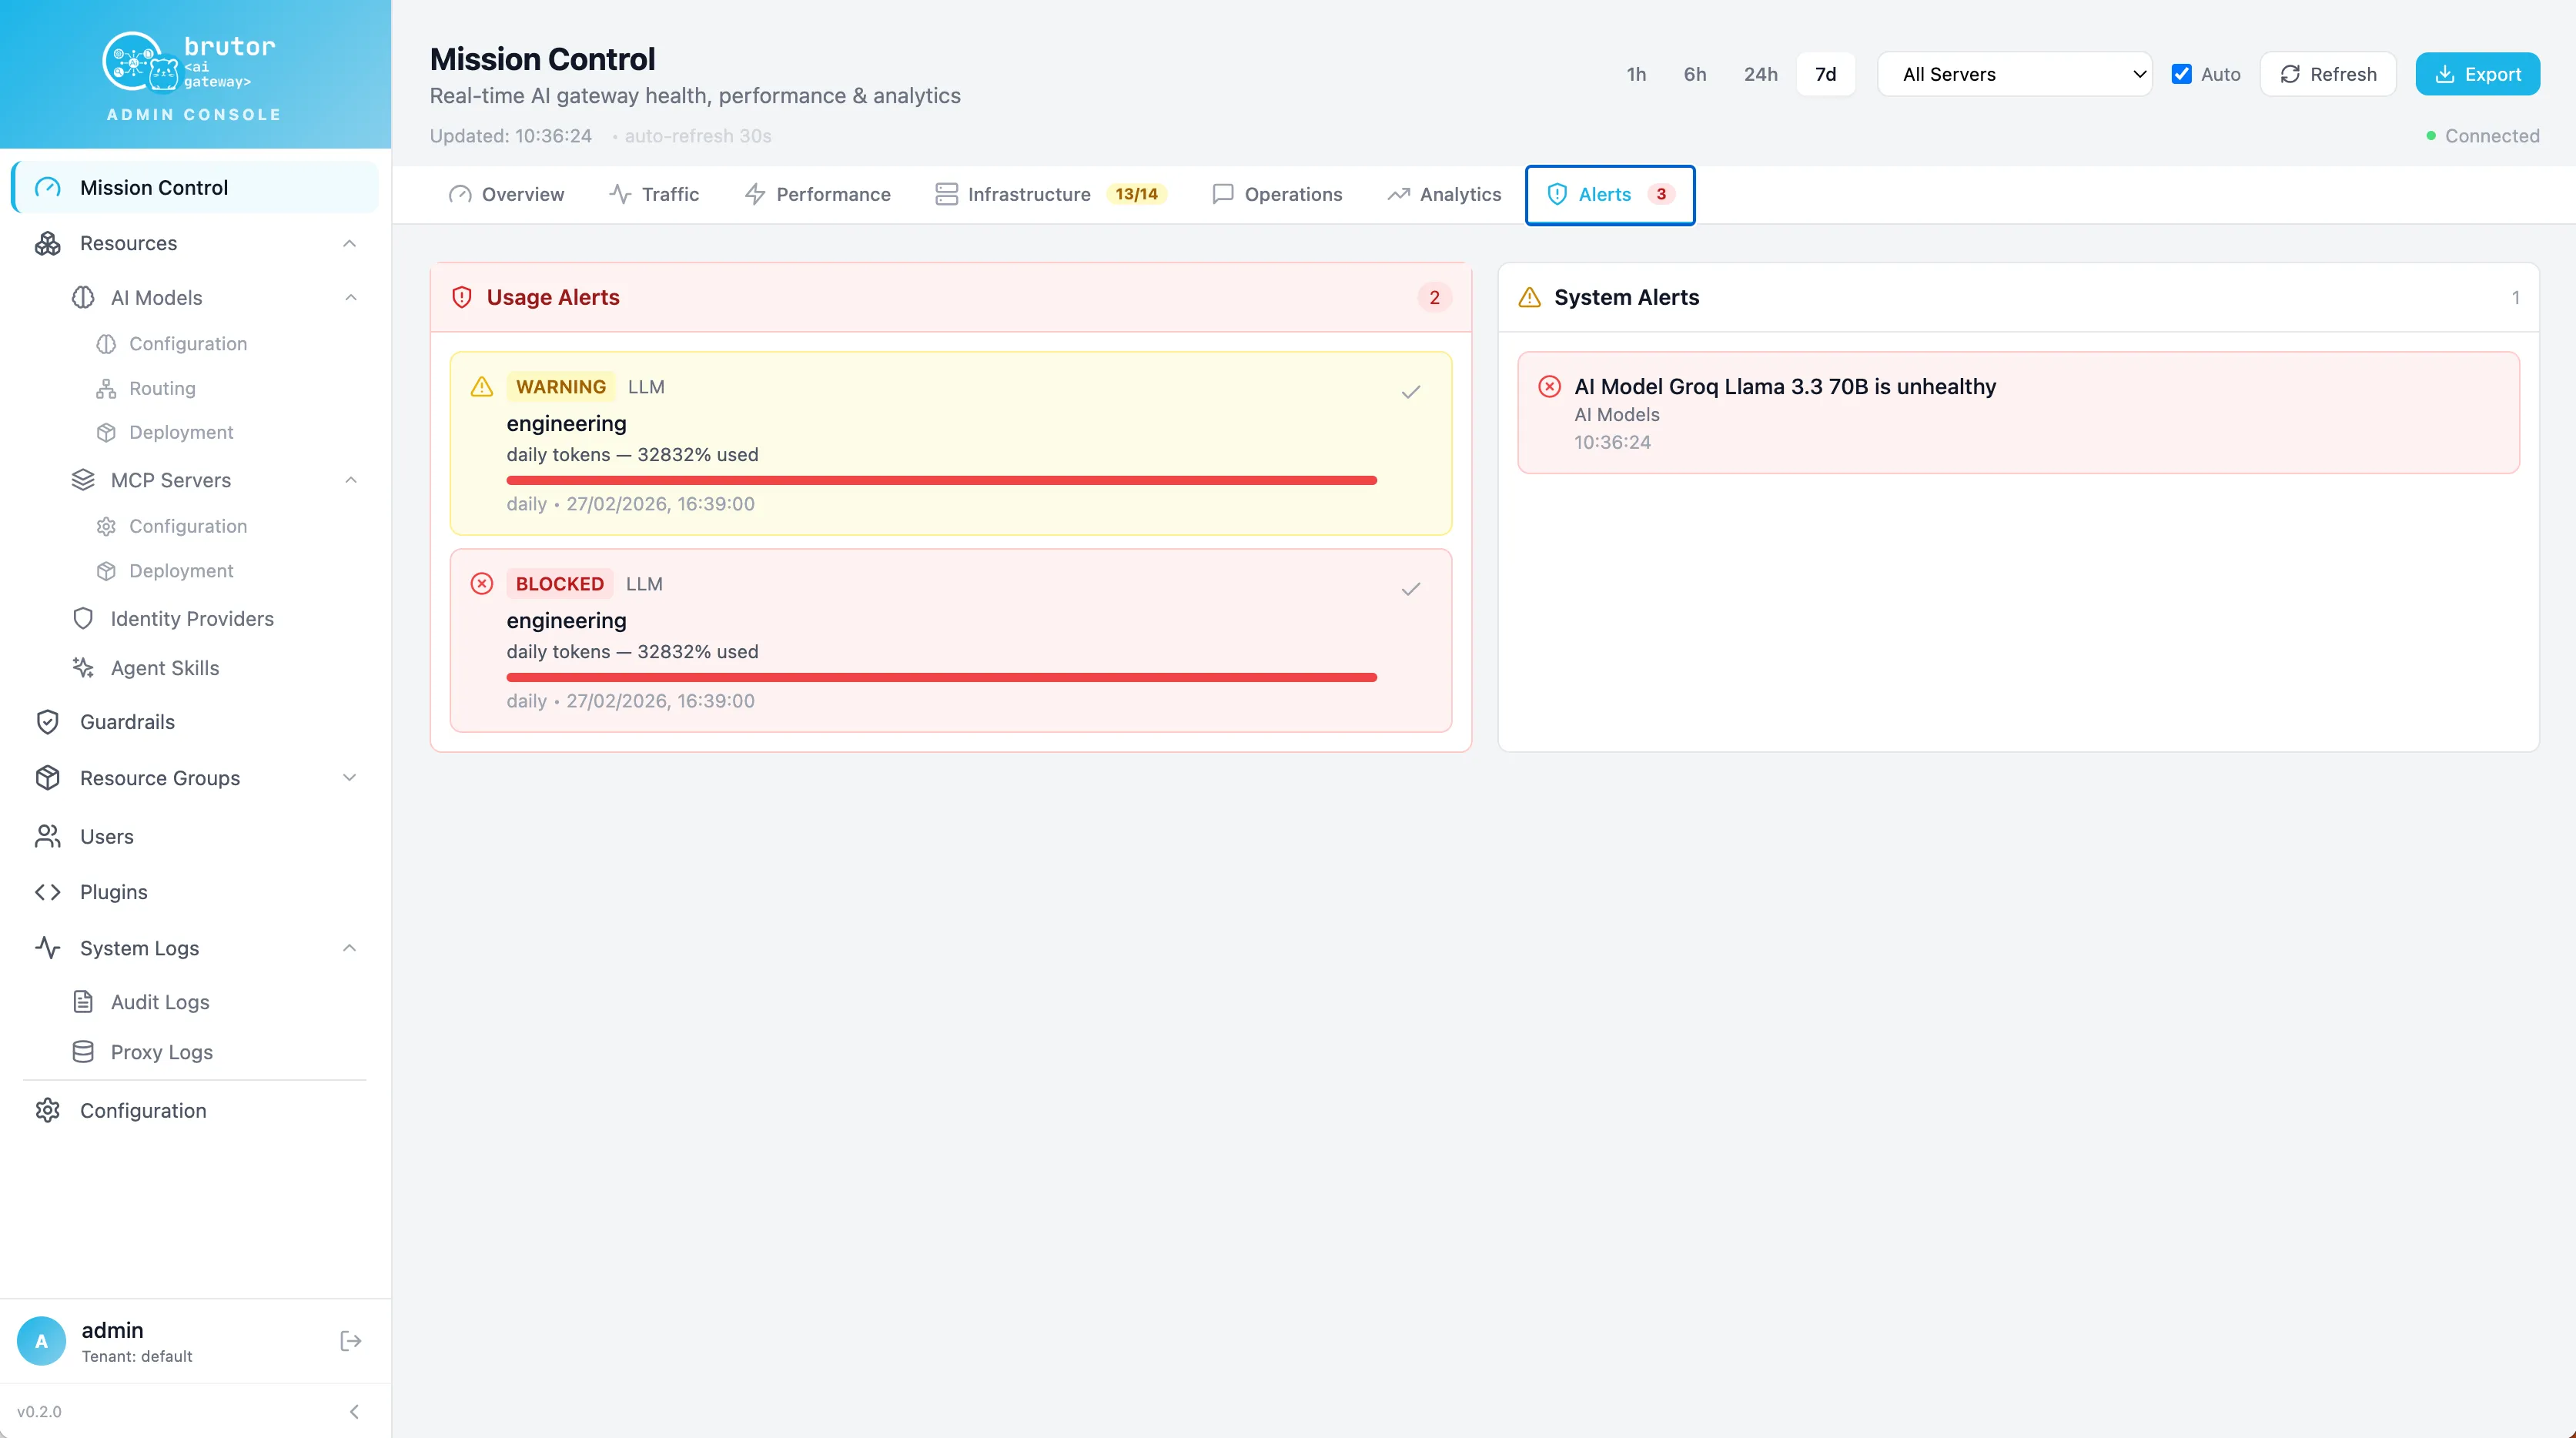
Admin API access per group: GET /v1/admin/resource-groups/{group_id}/usage-alerts, acknowledge with POST /v1/admin/resource-groups/usage-alerts/{alert_id}/acknowledge.
Portal API (Core Proxy)
Section titled “Portal API (Core Proxy)”End users and agents see the same alerts through the runtime plane — useful for building “your team is at 80% of budget” banners into custom portals:
| Endpoint | Purpose |
|---|---|
GET /v1/portal/alerts |
Tenant-wide list. Filters: status (active/acknowledged/resolved), alert_type (warning/hard_stop), resource_type, group_id, limit (default 100, max 500) |
GET /v1/portal/alerts/group/{group_id} |
One group’s alerts (default 50, max 200) |
POST /v1/portal/alerts/{alert_id}/acknowledge |
Mark an alert acknowledged |
curl "http://localhost:8100/v1/portal/alerts?status=active&alert_type=warning" \ -H "Authorization: Bearer $PORTAL_JWT"{ "tenant_id": "default", "alerts": [ { "id": "ua-...", "alert_type": "warning", "metric": "monthly_budget", "period": "monthly", "threshold_pct": 80, "utilization_pct": 83.4, "status": "active" } ], "total_count": 1, "active_count": 1, "hard_stop_count": 0, "groups_affected": 1}Acknowledge flow
Section titled “Acknowledge flow”Acknowledging records who and when, and moves the alert out of the default “active” view — it does not change any limit or resume any traffic:
curl -X POST http://localhost:8100/v1/portal/alerts/ua-.../acknowledge \ -H "Authorization: Bearer $PORTAL_JWT"{ "id": "ua-...", "status": "acknowledged", "acknowledged_by": "42", "acknowledged_at": "2026-07-02T14:31:09Z", "message": "Alert acknowledged"}An alert resolves when the underlying condition clears (window rollover, limit raised) — hard-stop alerts pair with a resumed alert so the timeline shows both edges.
System alerts are separate
Section titled “System alerts are separate”Infrastructure/health alerts (provider outages, circuit breakers, DB issues) are a different stream with severity levels critical / high / medium / low, listed at GET /v1/admin/system-alerts and counted in the Prometheus metrics (proxy_system_alerts_raised_total). Usage alerts tell you about spending; system alerts tell you about breakage.
Related pages
Section titled “Related pages”- Budgets, quotas & rate limits — the thresholds these alerts watch
- Mission Control — the Alerts tab and budget burn-down views
- Build a custom portal — putting portal alerts in front of end users