

The run ledger
Everything assurance concludes is computed from what actually happened — and the run ledger is where “what happened” lives. It answers: what did this system actually do, and what did each completed task cost?
The four units
Section titled “The four units”Brutor names execution the way the wider ecosystem does, so a number here means the same thing as the number on your orchestrator’s dashboard (the full vocabulary, with the agent loop, is in the anatomy of a run):
| Unit | What it is | Where it comes from |
|---|---|---|
| Run | One task, start to terminal state | Gateway-signed chain, or a client x-brutor-run-id |
| Step | A logical phase of the plan — “research”, “settle” | Client-asserted only (X-Brutor-Step-Id); never inferred |
| Turn | One pass of the agent loop — a model call plus what it triggered | Asserted (X-Brutor-Turn-Id) or inferred from model-call boundaries |
| Action | One governed call — LLM, MCP tool, skill, or A2A | Always observed; this is what the gateway sees |
The run ledger
Section titled “The run ledger”A run is one end-to-end task, not one HTTP request. An agent that classifies a question, looks a customer up, loads a policy skill, escalates to a peer agent and composes an answer has made six calls to do one job — and that is one run.
There are two ways actions become one run, and which one applies depends on who drives the loop:
-
Gateway-delegated actions ride the HMAC-signed call chain the gateway mints and forwards (LLM → MCP → A2A → skill). Nothing to instrument: the gateway signs the linkage, and those actions record
trace_continuity: verified. -
Self-driving agents — a LangGraph/CrewAI-style loop that calls the gateway action by action from its own process — have no chain to echo, because the gateway never sees the iteration happen. Such an agent sends one header on every call of a task:
x-brutor-run-id: <any opaque id, unique per task>The gateway derives the real run root from that id, keyed by the tenant secret and bound to the calling credential — so an agent can group its own work and cannot write itself into another principal’s run, and the same id from two credentials lands in two different runs. These actions record
trace_continuity: client_asserted, and the run’s integrity readsclient_assertedrather thanintact: the coverage is complete, and the linkage rests on the client’s word instead of a signature. The ledger keeps that distinction visible instead of rounding it up.
Optionally, the last call of a task can carry X-Brutor-Run-End with one of the seven
terminal states (completed, completed_degraded, exhausted, errored,
blocked_policy, abandoned, cancelled) so the run closes immediately with an
explicit outcome instead of waiting for the idle sweeper — a run nobody closes is recorded
abandoned, which is indistinguishable from a crash, and exhausted (the agent hit
its iteration cap) is only ever set from this signal because the gateway cannot
observe a framework’s cap from outside. X-Brutor-Run-End: true is ignored on proxy
calls; only the body of POST /v1/runs/{root}/end accepts true, meaning “ended, infer
the state”.
The same call can also carry what the task came to — X-Brutor-Run-Outcome: resolved (or escalated, handed_off, abandoned_by_user) — or the client can close
the run with POST /v1/runs/{root}/end and {"state": "completed", "outcome": "resolved"}. A terminal state is what the gateway derived; a client outcome is what
the client claims, and the ledger keeps them as two columns with two authors. Run stats
report the outcome mix beside its own coverage (client_outcome_reported_pct), so a
resolved rate over three reported runs is never mistaken for a rate over three hundred.
A third source of steps needs no headers at all: a system that does not route through
the gateway can export its own OpenTelemetry GenAI spans to the
inlet. Those steps record trace_continuity: external
and source: otel — complete as reported, never as witnessed.
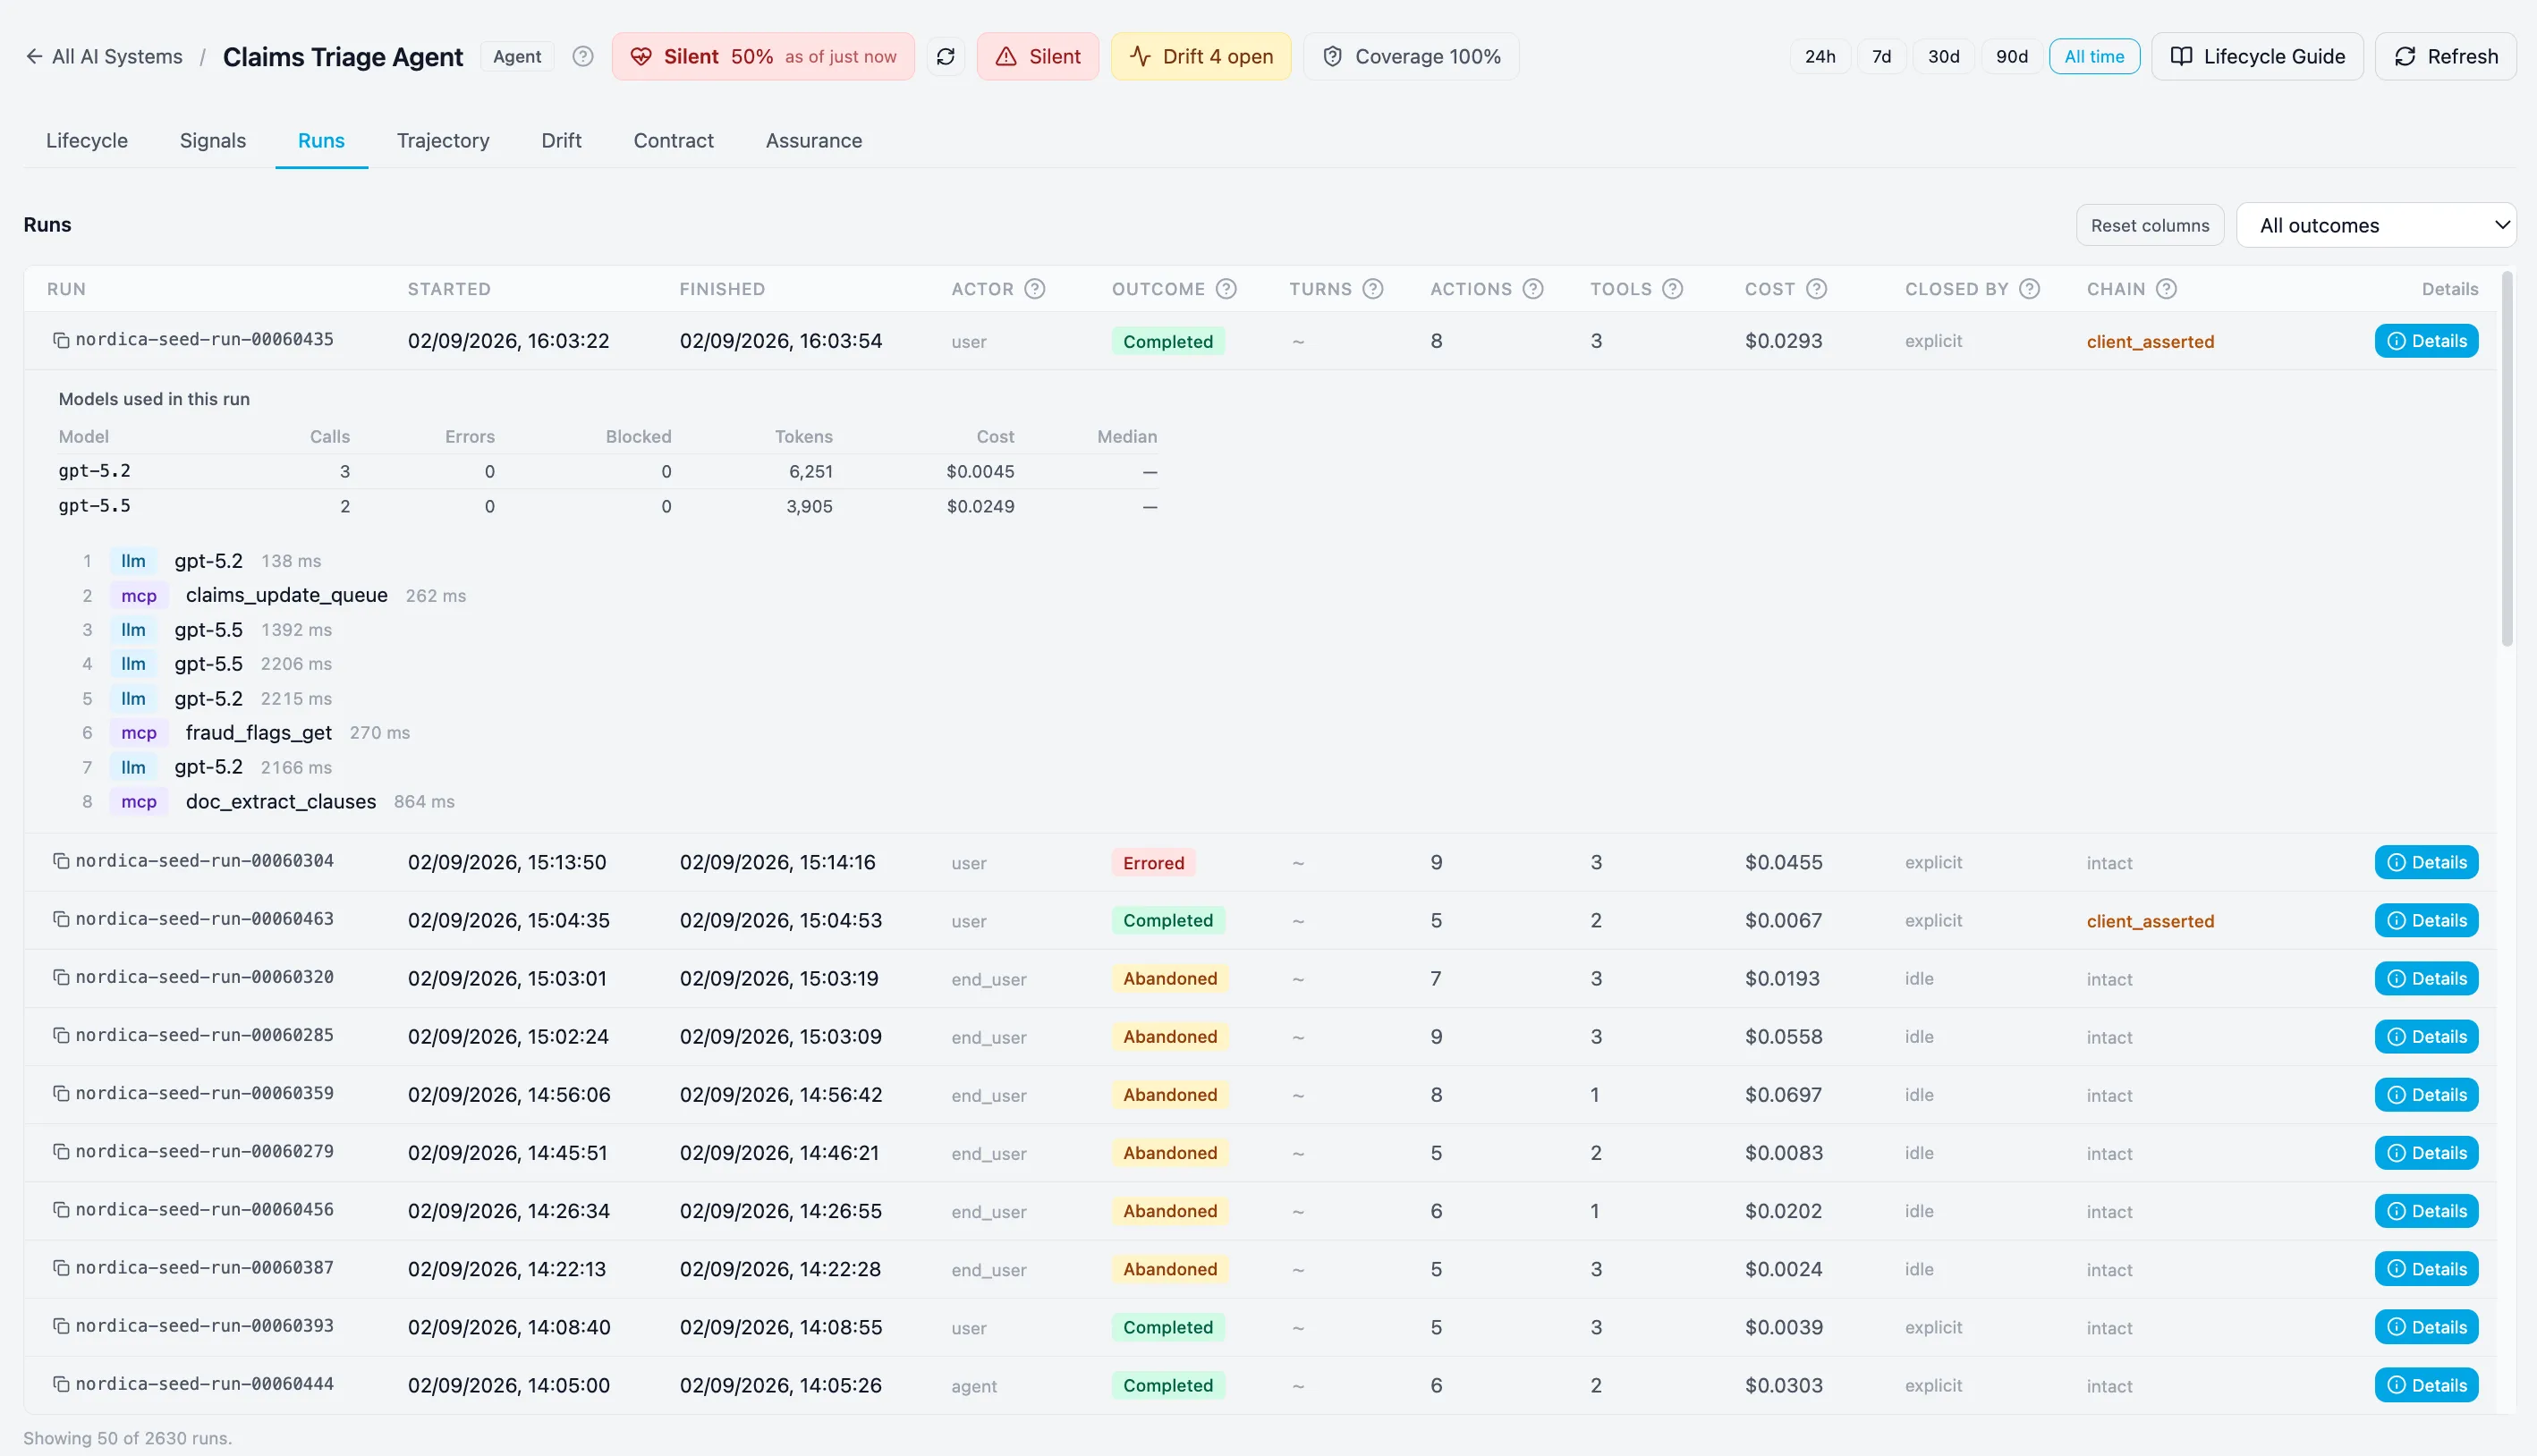
Each row in ai_system_runs records:
- outcome — a terminal state (
completed,errored,abandoned,exhausted, …) - shape — action count, tool calls, delegation depth, the set of tools used
- cost — tokens and dollars, attributed to the completed task rather than smeared across requests
- actor and subject — who acted (an agent identity, an end user, an API key) and who
they acted for when the call was delegated (
subject_id,subject_kind), so a standing check can be written about delegated authority - integrity — how the actions were linked:
intact(gateway-signed),client_asserted(complete, grouped by the client’s run id),observed_external(complete as reported by an OpenTelemetry exporter — nothing signed, nothing credential-bound), orpartial/broken(fragments — these are excluded from baselines), plus how many times the run was reopened by a late action - source —
gateway,otelormixed: whether the gateway witnessed the steps or was told about them (see Evidence sources) - instructions and corpus — a SHA-256 fingerprint of the system instructions the run was given (never the prompt itself) and the knowledge-base collections it retrieved from, so drift can name a prompt edit or a corpus change as the cause
- outcome feedback — an optional human rating of the answer (see below); absent on most runs, and absence reads as unknown rather than as satisfactory
Find them under AI Estate → AI Systems → (a system), which opens on Lifecycle — a status strip (health with its computed-at age, liveness, open drift, coverage) stays pinned above seven tabs: Lifecycle (the governance stage rail, its gates and replay), Signals (one sub-tab per family: Liveness, Cost, Trajectory, Errors, Outcomes), Runs (rows expand into an action-by-action timeline; Details on a row opens every field the ledger holds, the governing contract included), Trajectory (see below), Drift, Contract (Active, Operating envelope, External evidence) and Assurance (Conclusion, Evidence, Exceptions & changes, Snapshots).
Knowing which run answered
Section titled “Knowing which run answered”The correlation runs both ways. Whatever the client sends, every LLM response carries the run it belongs to back out:
x-brutor-run-id: <the run's root id>This is not an echo of what was sent. The gateway derives the run root from the asserted id (keyed by tenant secret and calling credential, as above), so the value that comes back is the derived root — the id the ledger is actually keyed on. Re-asserting a returned id on the next request would derive a second, different root; assert your own task id and use the returned one for lookups.
That is what lets a client attach something to the run it just saw — a rating, a support ticket, a trace link — without the server having to guess from timing, which is wrong the moment a user has two tabs open.
Outcome feedback
Section titled “Outcome feedback”Everything above is behaviour: how many actions, which tools, what it cost, whether the calls succeeded. A run can be clean on every one of those and still have answered wrongly. Nothing observed from the outside can tell the difference.
So runs also carry an optional outcome signal — a thumbs rating from the person who read the answer:
curl -X POST "$GATEWAY/v1/portal/runs/$RUN_ID/feedback" \ -H "X-Gateway-Authorization: Bearer $PORTAL_JWT" \ -H "X-Tenant-ID: $TENANT" \ -H "Content-Type: application/json" \ -d '{ "score": 1, "comment": "optional — what was wrong with it" }'{ "run_id": "01JBRUTORRUNROOT0000000000", "score": 1 }1 up, -1 down, 0 withdraws a rating (the response then carries "score": null).
run_id is the value from the response header above. A rating is accepted only from a
user who actually appears in that run, and only within their own tenant — anything else
returns 404.
The Brutor portal sends this from the thumbs on each answer. Anything else driving the gateway can send it too — that is what makes the signal available to your own front end rather than only to ours.
The Trajectory Explorer
Section titled “The Trajectory Explorer”Two questions the run list cannot reach, and the tab that answers them:
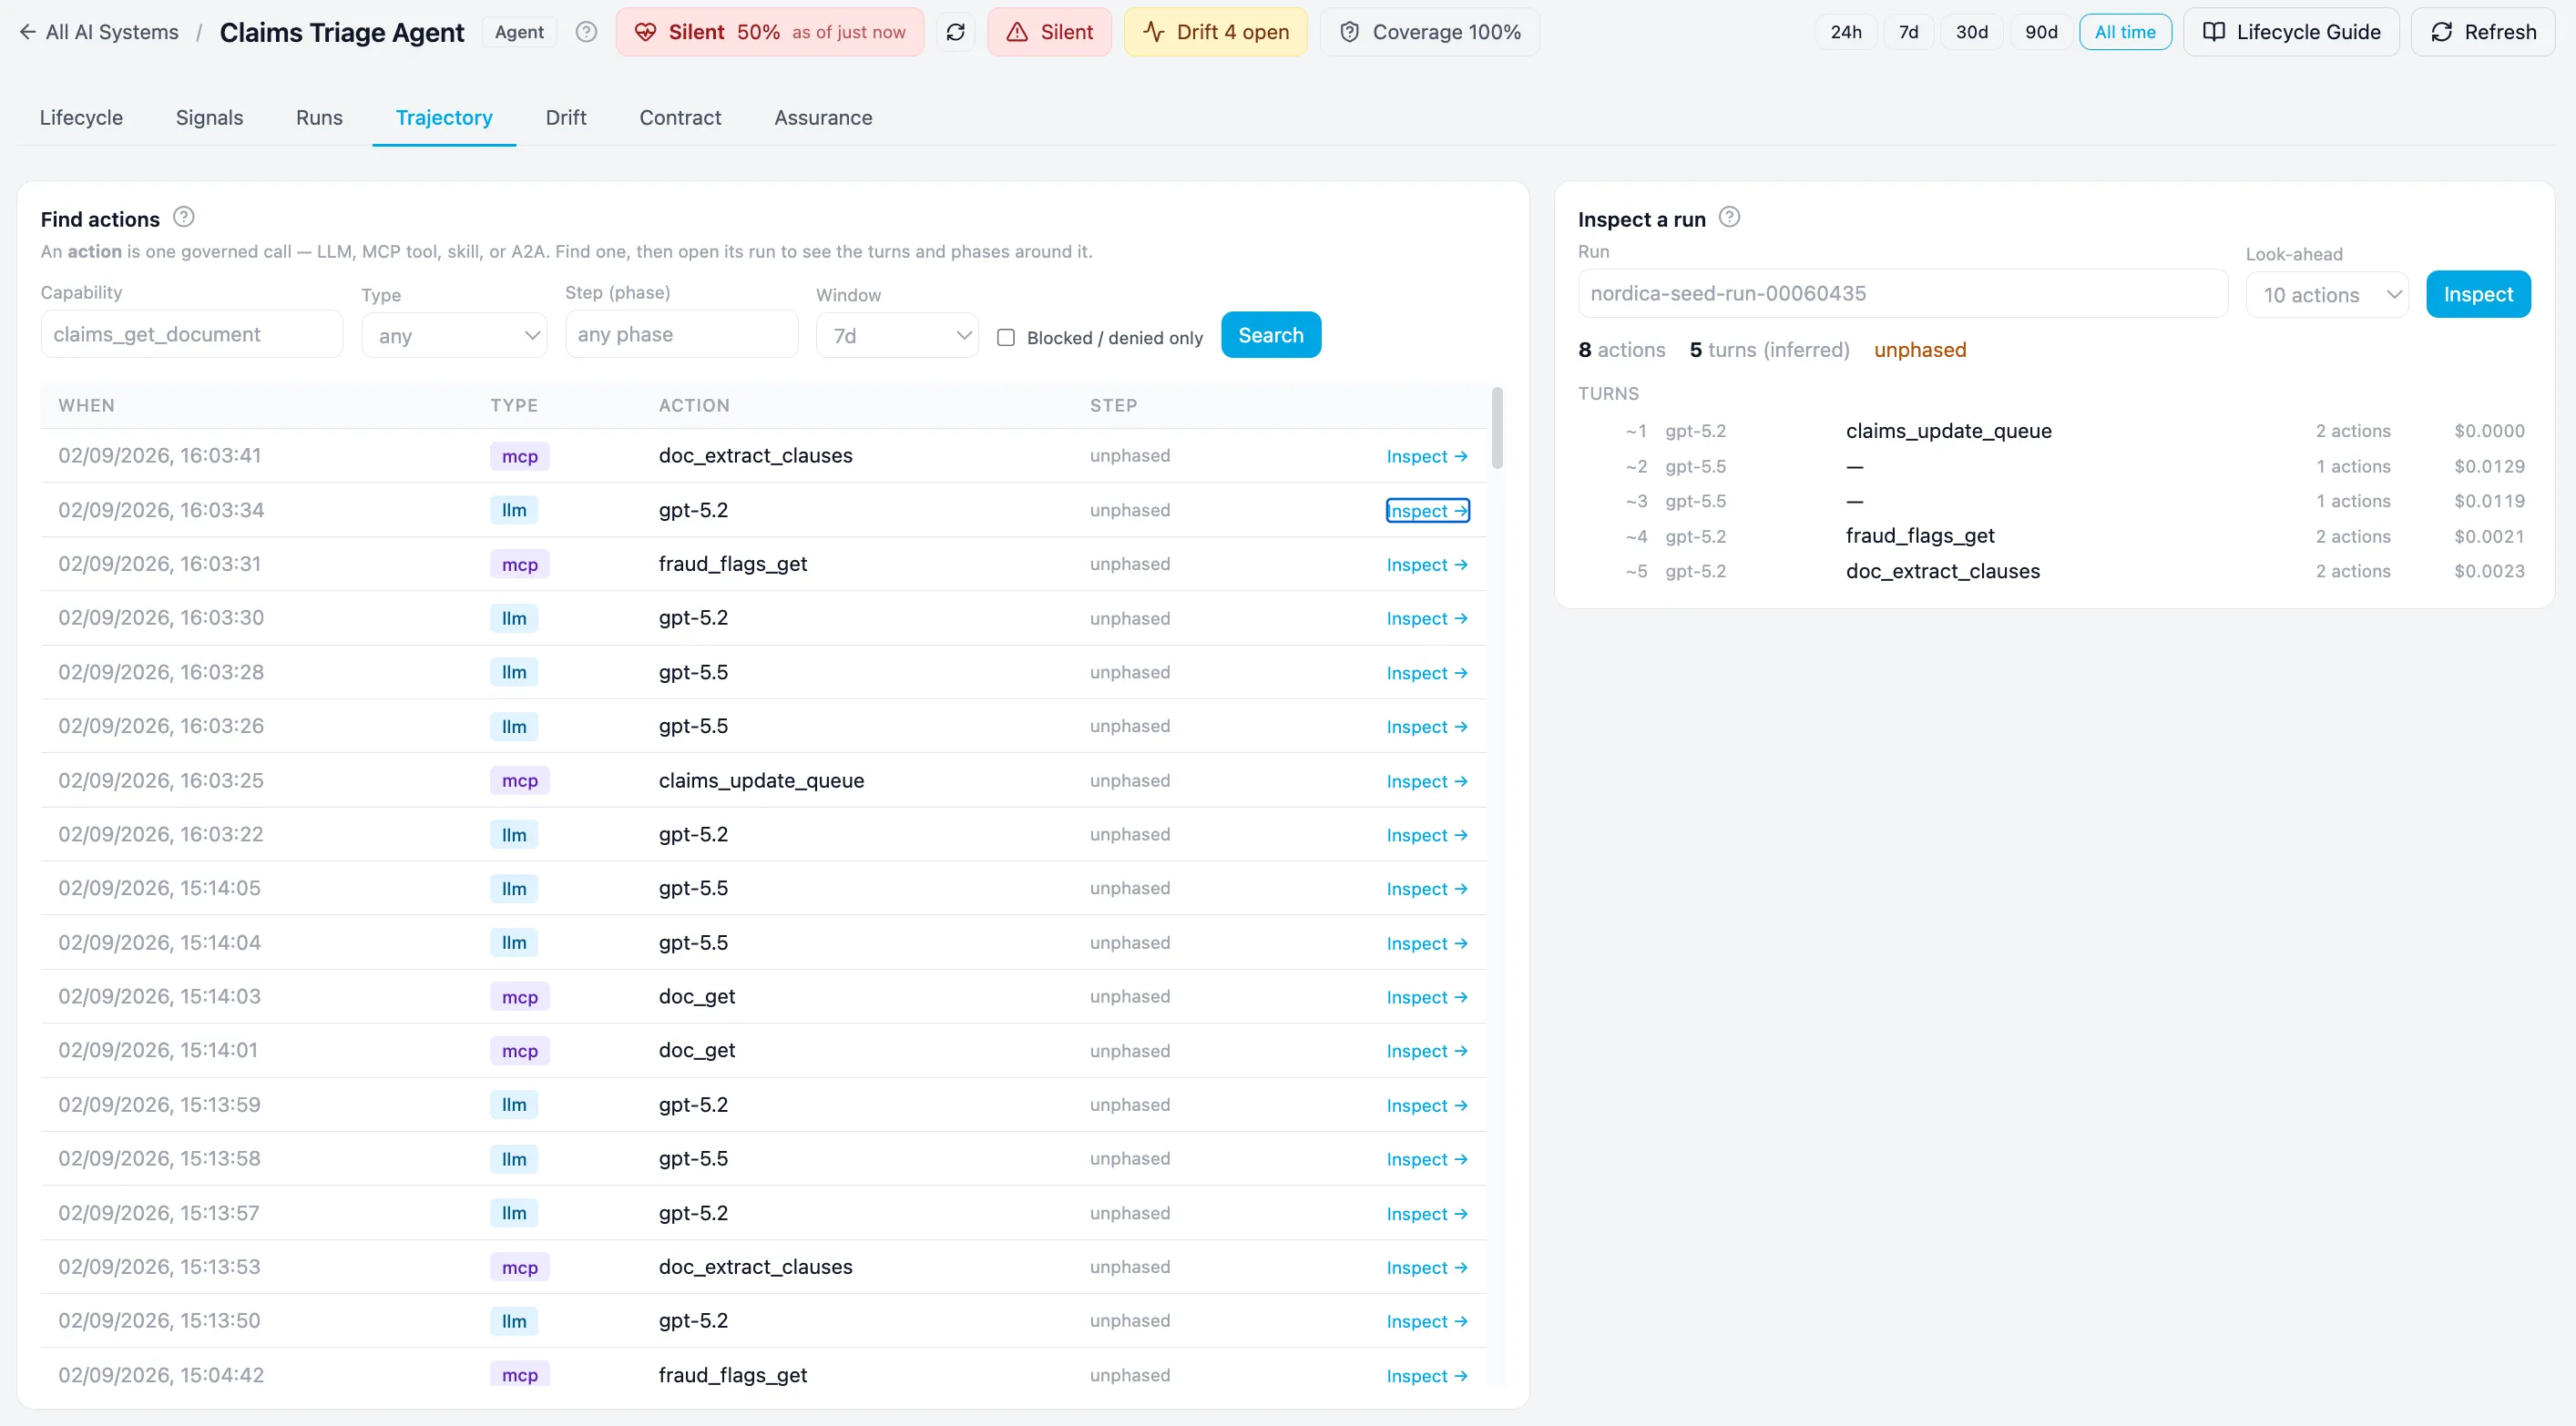
- “All tool calls that originated from step X inside run Y — and their parent turns.” Pick a phase and the view regroups to just its turns, each with the actions and tools it contained and what it cost.
- “Where did a check trip, and what ran shortly afterwards?” Bounded by a look-ahead you choose, in execution order.
There is also a fleet-wide find pane — by capability, action type, phase name, or blocked-only — for when you know the tool but not the run.
A run closes when the chain ends or when it has been idle past
run_idle_timeout_seconds (default 120s, configurable per system — an integration may
legitimately pause for minutes between actions where an application should not).
Runs that were only partly observed are marked and excluded from baselines. Folding a fragment into “normal” would lower the apparent action count and then flag every complete run as drift.
Related
Section titled “Related”- The anatomy of a run — the vocabulary, from first principles
- Evidence sources — witnessed versus reported steps
- Data handling — what the ledger keeps, for how long, and who can read it
- Liveness and behavioural drift — the watchers computed from this ledger
- The gate & replay — how recorded runs become an eval set
- Action records — each step of a run sealed as a signed record, with its verdict and chain links (shown under sealed steps in run details)