
Logs & Audit Trail
Brutor keeps three distinct log streams, each with a different job:
| Stream | Job | Loss tolerance |
|---|---|---|
| Proxy logs | Forensics: every runtime request with full context | Best-effort under extreme load |
| Usage logs | Metering ledger: billing, quotas, cost attribution | Never dropped |
| Audit logs | Evidence: admin config changes + governance decisions | Immutable, insert-only |
Proxy logs
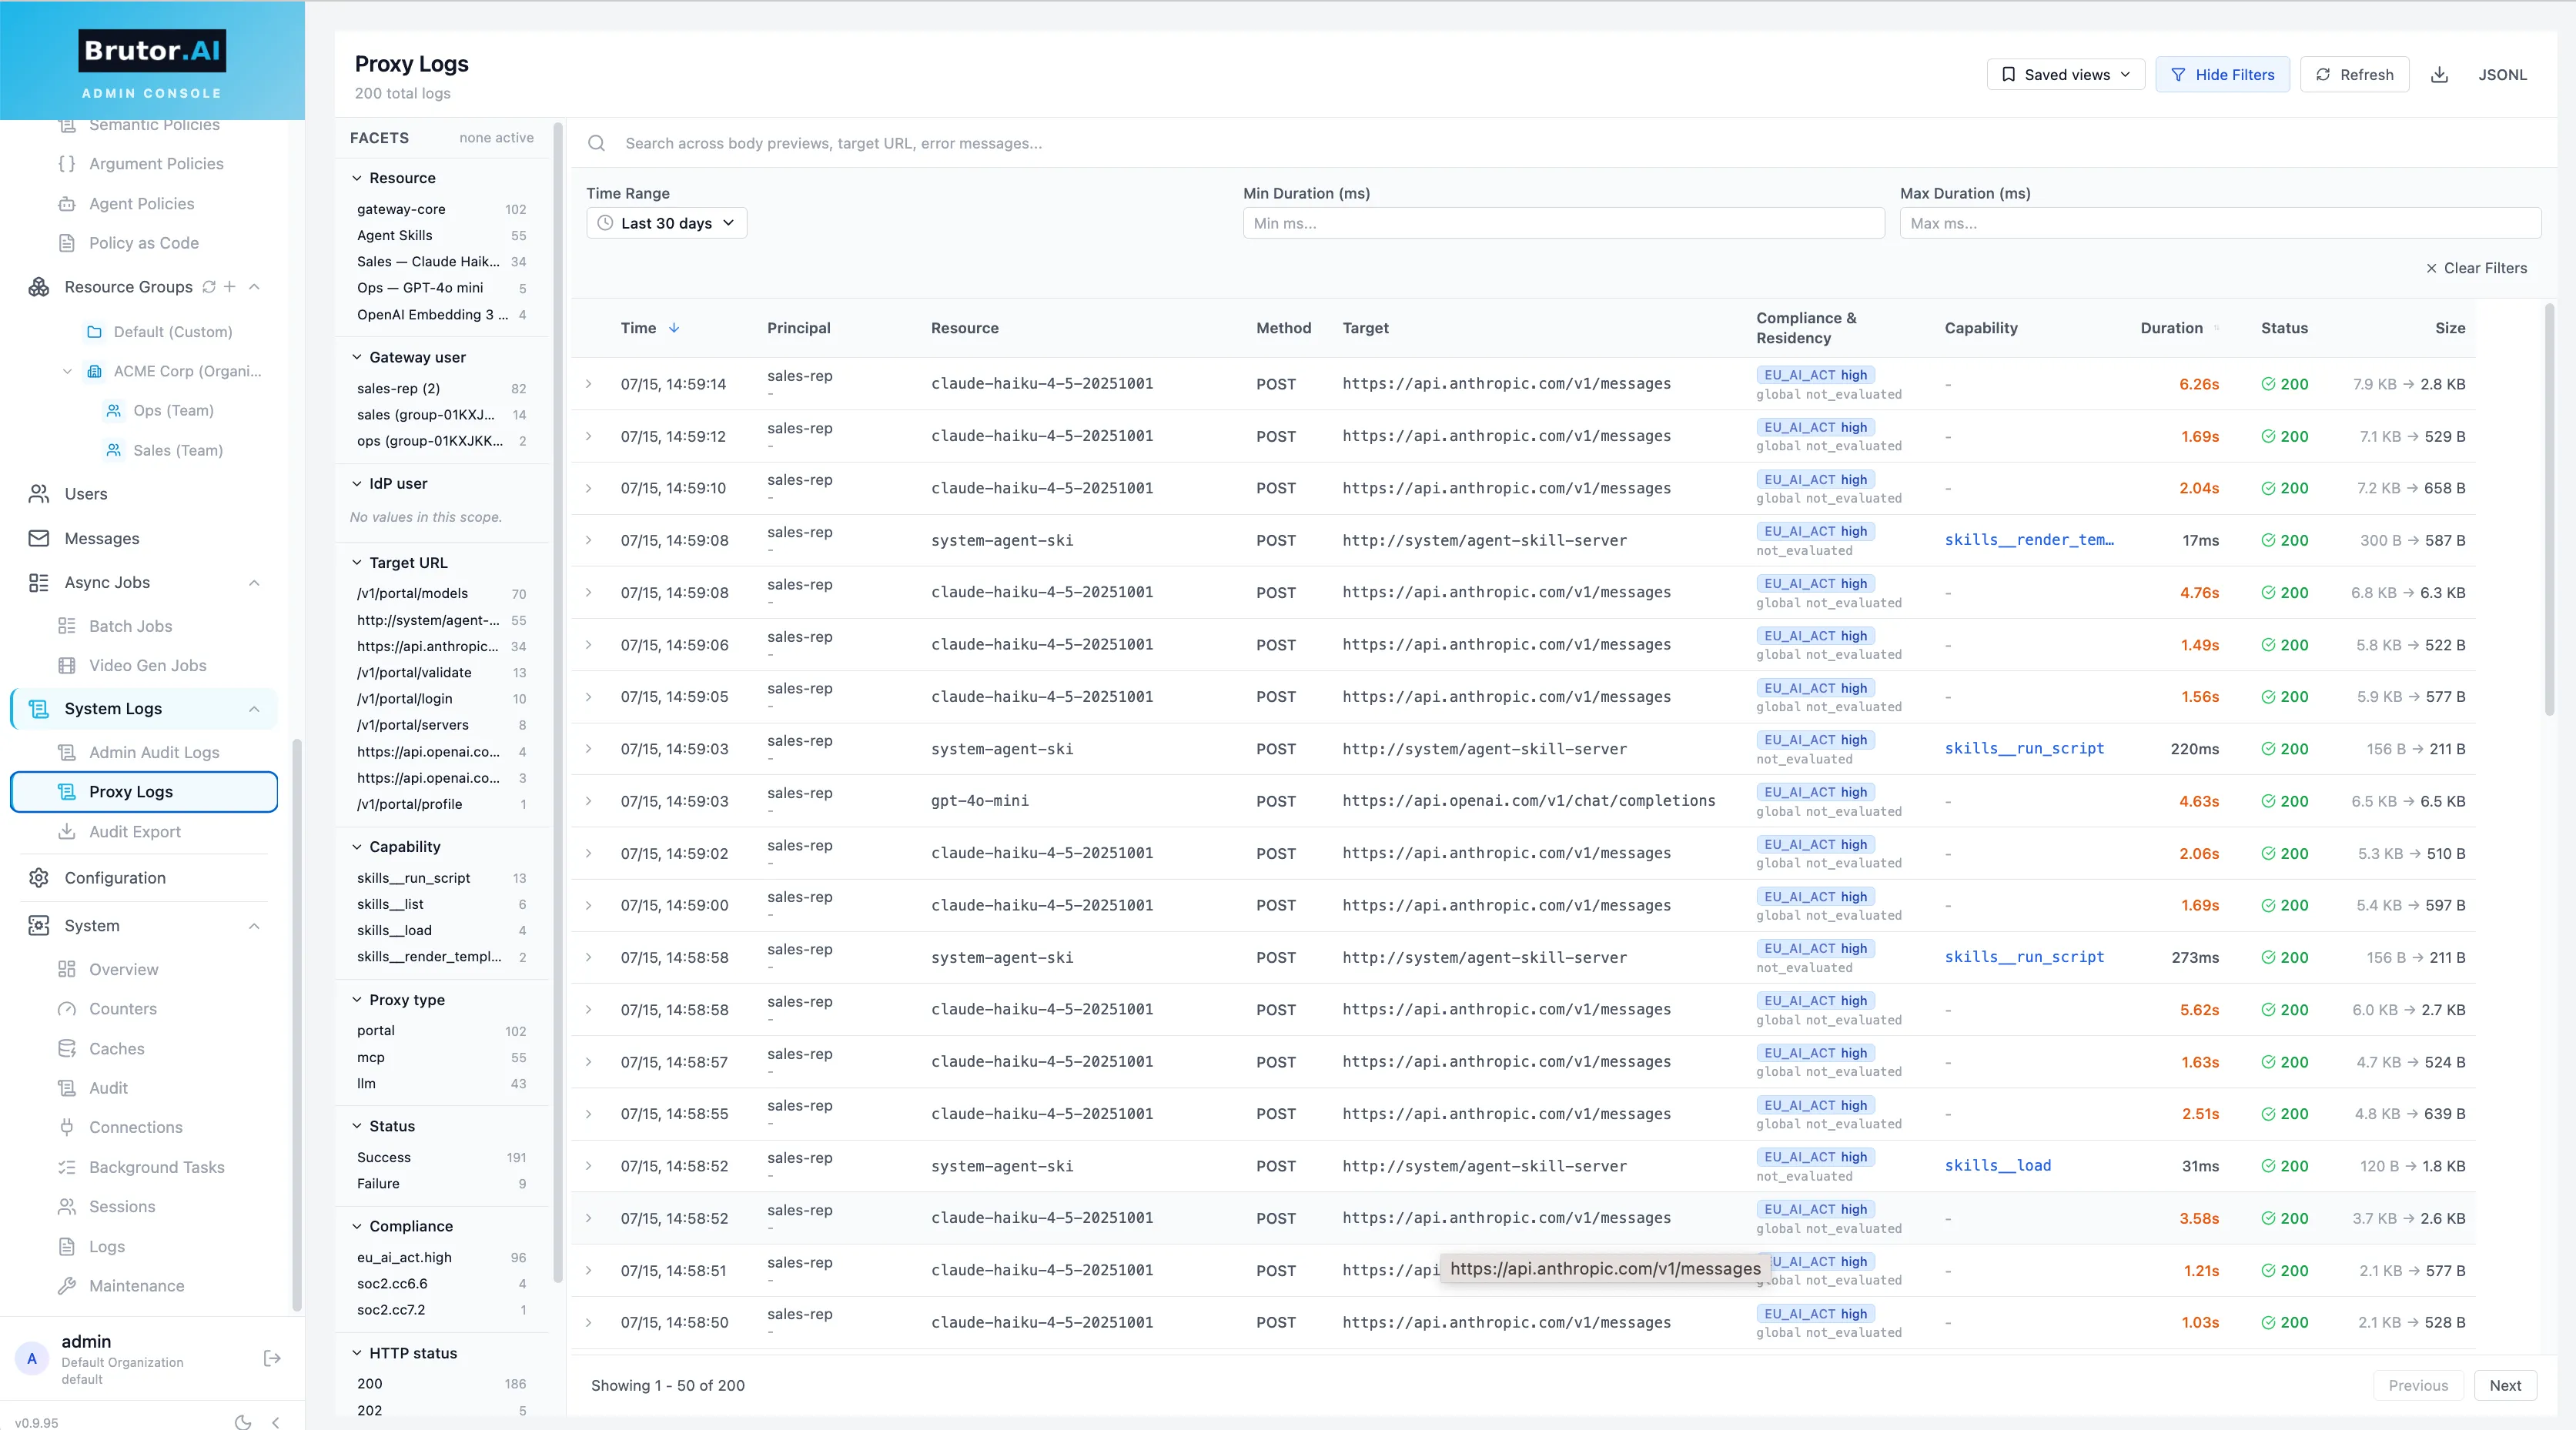
Section titled “Proxy logs”Every request through the Core Proxy — LLM, MCP, Virtual MCP, skill, OAuth, A2A — writes a proxy-log row:
- Classification —
proxy_type(llm,mcp,virtual-mcp,skill,oauth,a2a) andproxy_subtype(e.g.chat_completions,embeddings,anthropic_messages,sse_stream, and governance outcomes likeapproval_required,semantic_policy_block,residency_violation) - Outcome —
http_status_code,success,duration_ms - LLM economics — resolved model,
llm_prompt_tokens,llm_completion_tokens,llm_total_tokens,llm_estimated_cost_usd; media counters for image/audio/video - Governance —
guardrail_blocked,argument_policy_denied,pii_detected, agent-authz decision, compliance tags - Attribution — user, group, API key, agent identity, and the full call-chain (
root_task_id/parent_task_id/delegation_depth) so multi-agent delegations read as one trace - Provenance —
source(gatewayfor inline traffic,import:*for observed/imported telemetry) - Bodies — request and response previews
Viewing and querying
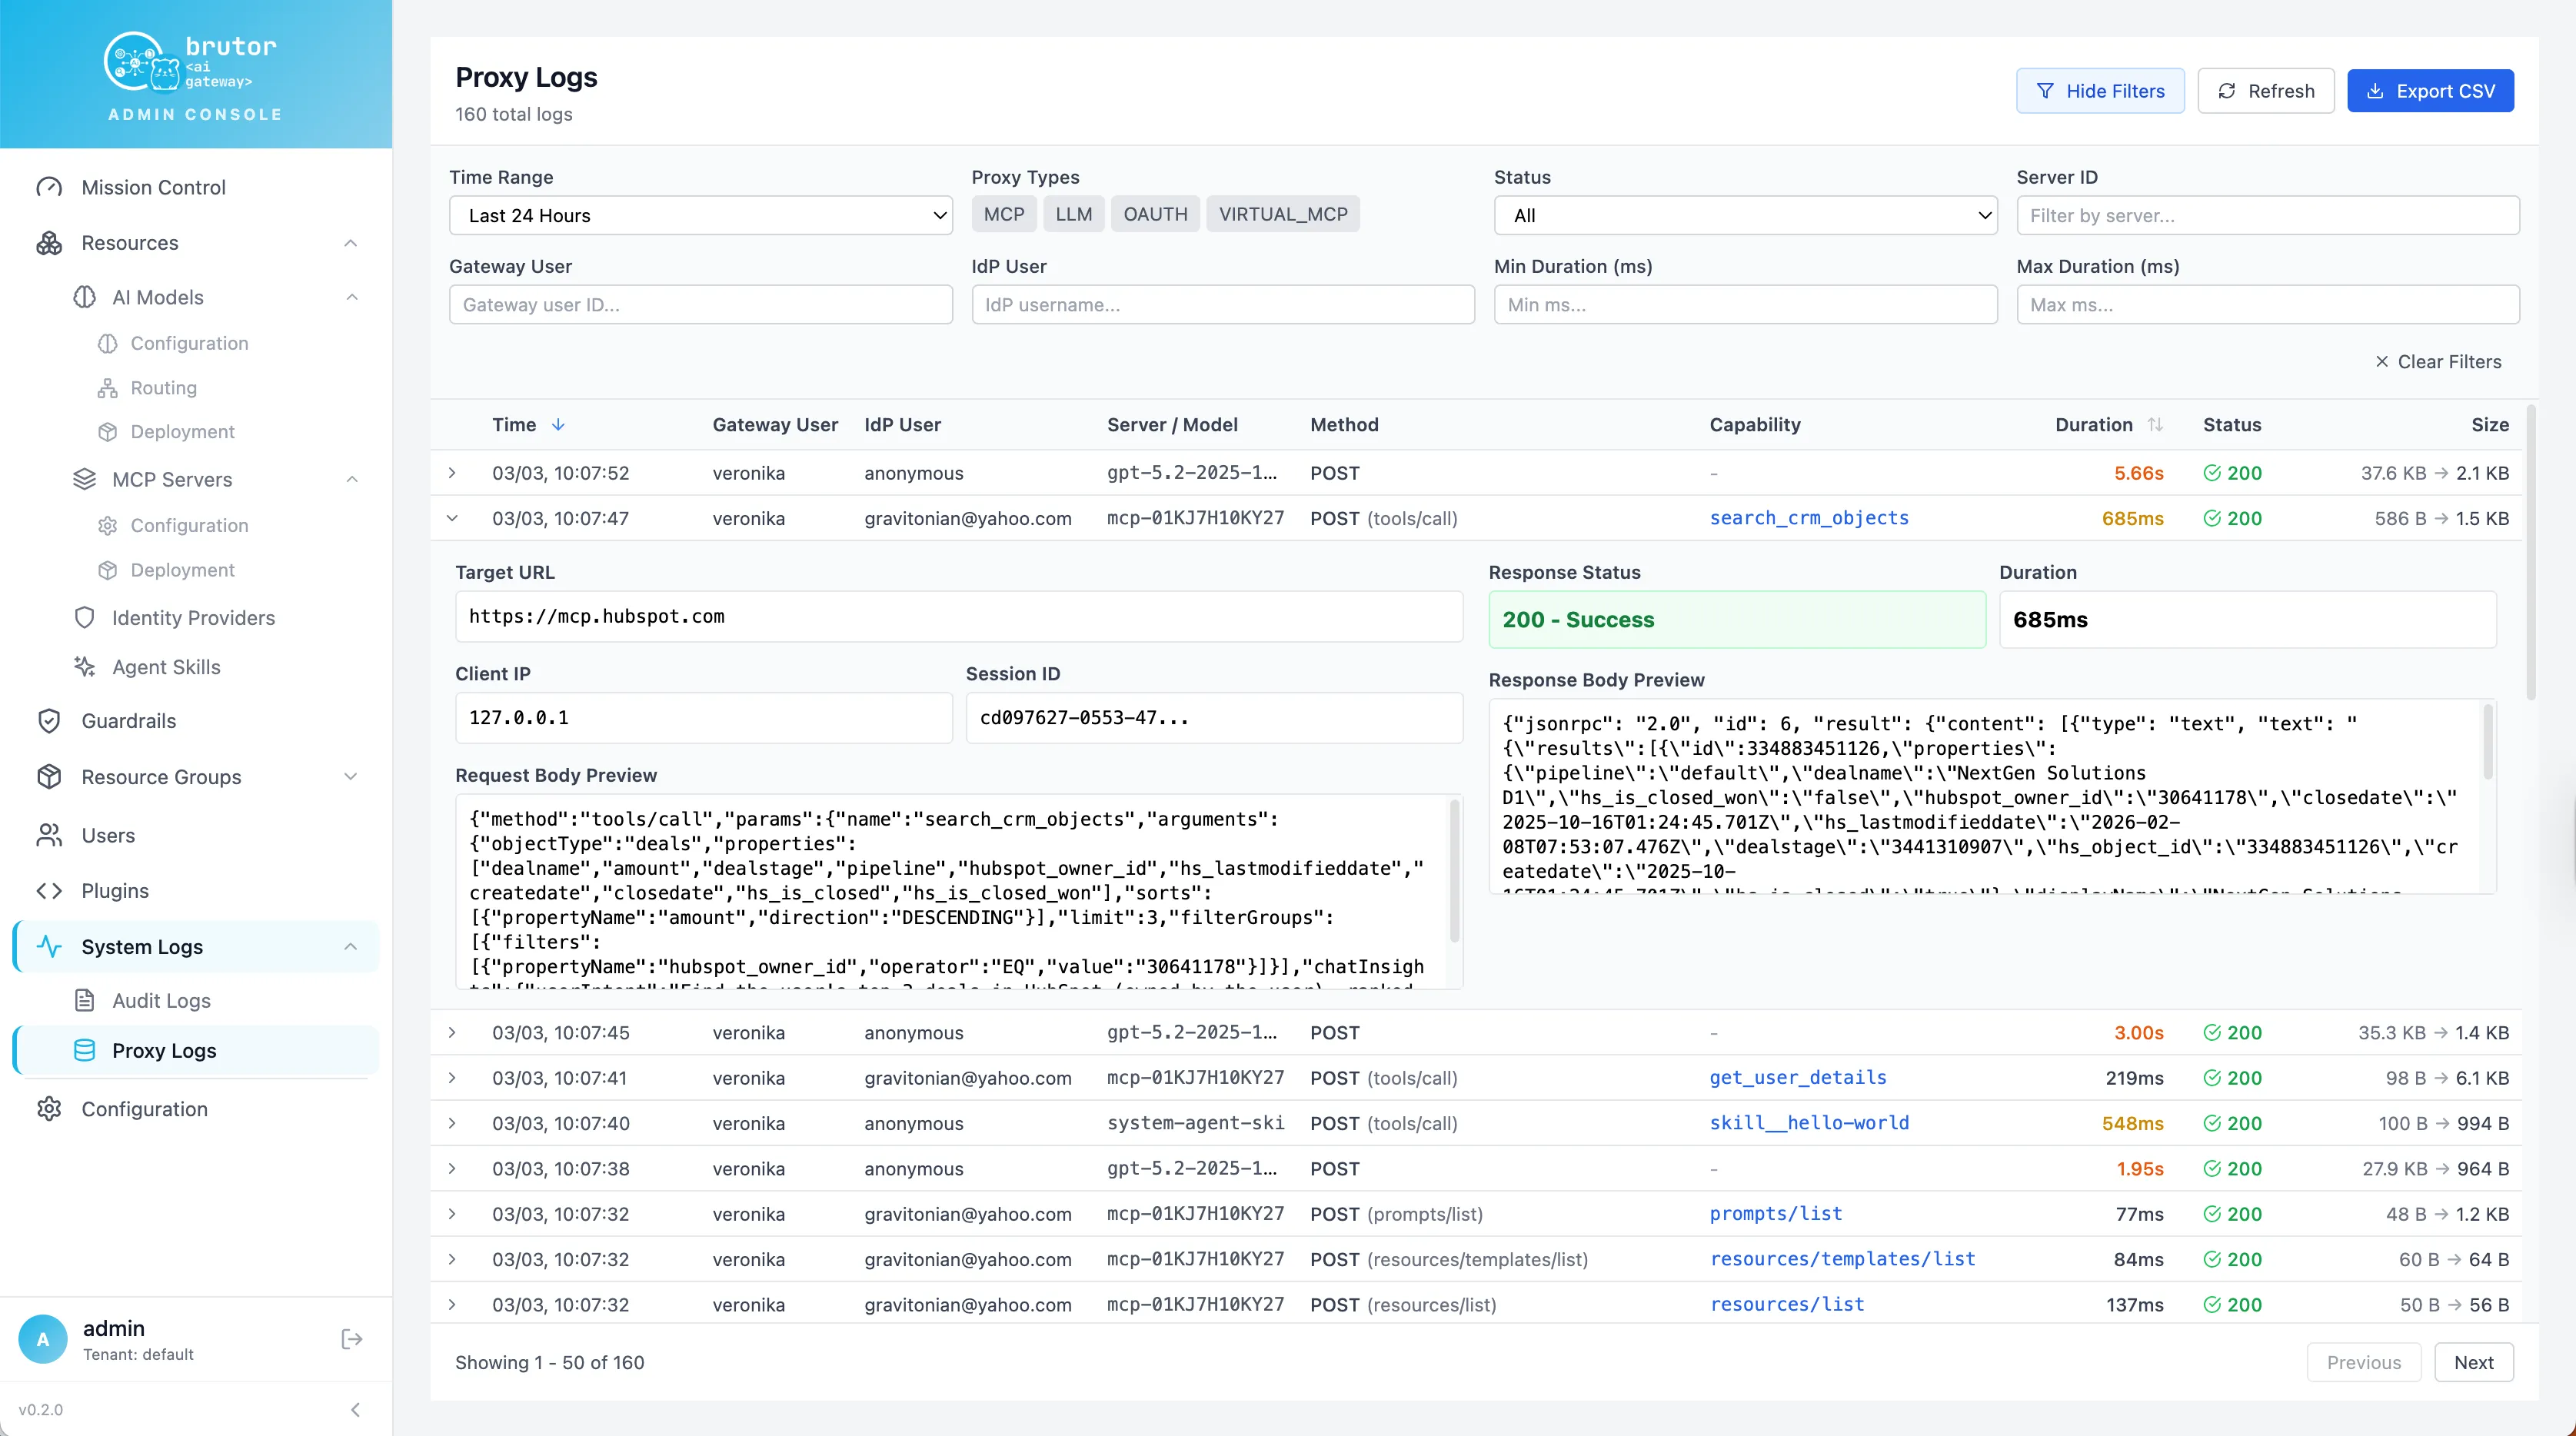
Section titled “Viewing and querying”In the Admin UI, the proxy log explorer lives under Monitoring — filter by type, user, server, model, status, duration, correlation ID, or compliance tags, and expand a row for the full request/response detail:
Programmatically, the same power is one endpoint:
curl -X POST http://localhost:5050/v1/admin/proxy-logs/query \ -H "Authorization: Bearer $ADMIN_TOKEN" \ -H "Content-Type: application/json" \ -d '{ "proxy_type": "llm", "success": false, "limit": 50 }'System-level views (including live tailing) are under Syslogs:
Usage logs
Section titled “Usage logs”The usage ledger is the money-and-quota record: one row per metered event with user_id, group_id, ancestry_path (for hierarchical roll-ups), resource_type (llm / mcp / skill), token counts, estimated_cost with prompt/completion split, MCP tool metrics, and source provenance. Quota enforcement, Mission Control cost views, and per-group usage tabs are all built on it.
Audit logs
Section titled “Audit logs”Two immutable trails cover the “who changed what, who decided what” questions:
-
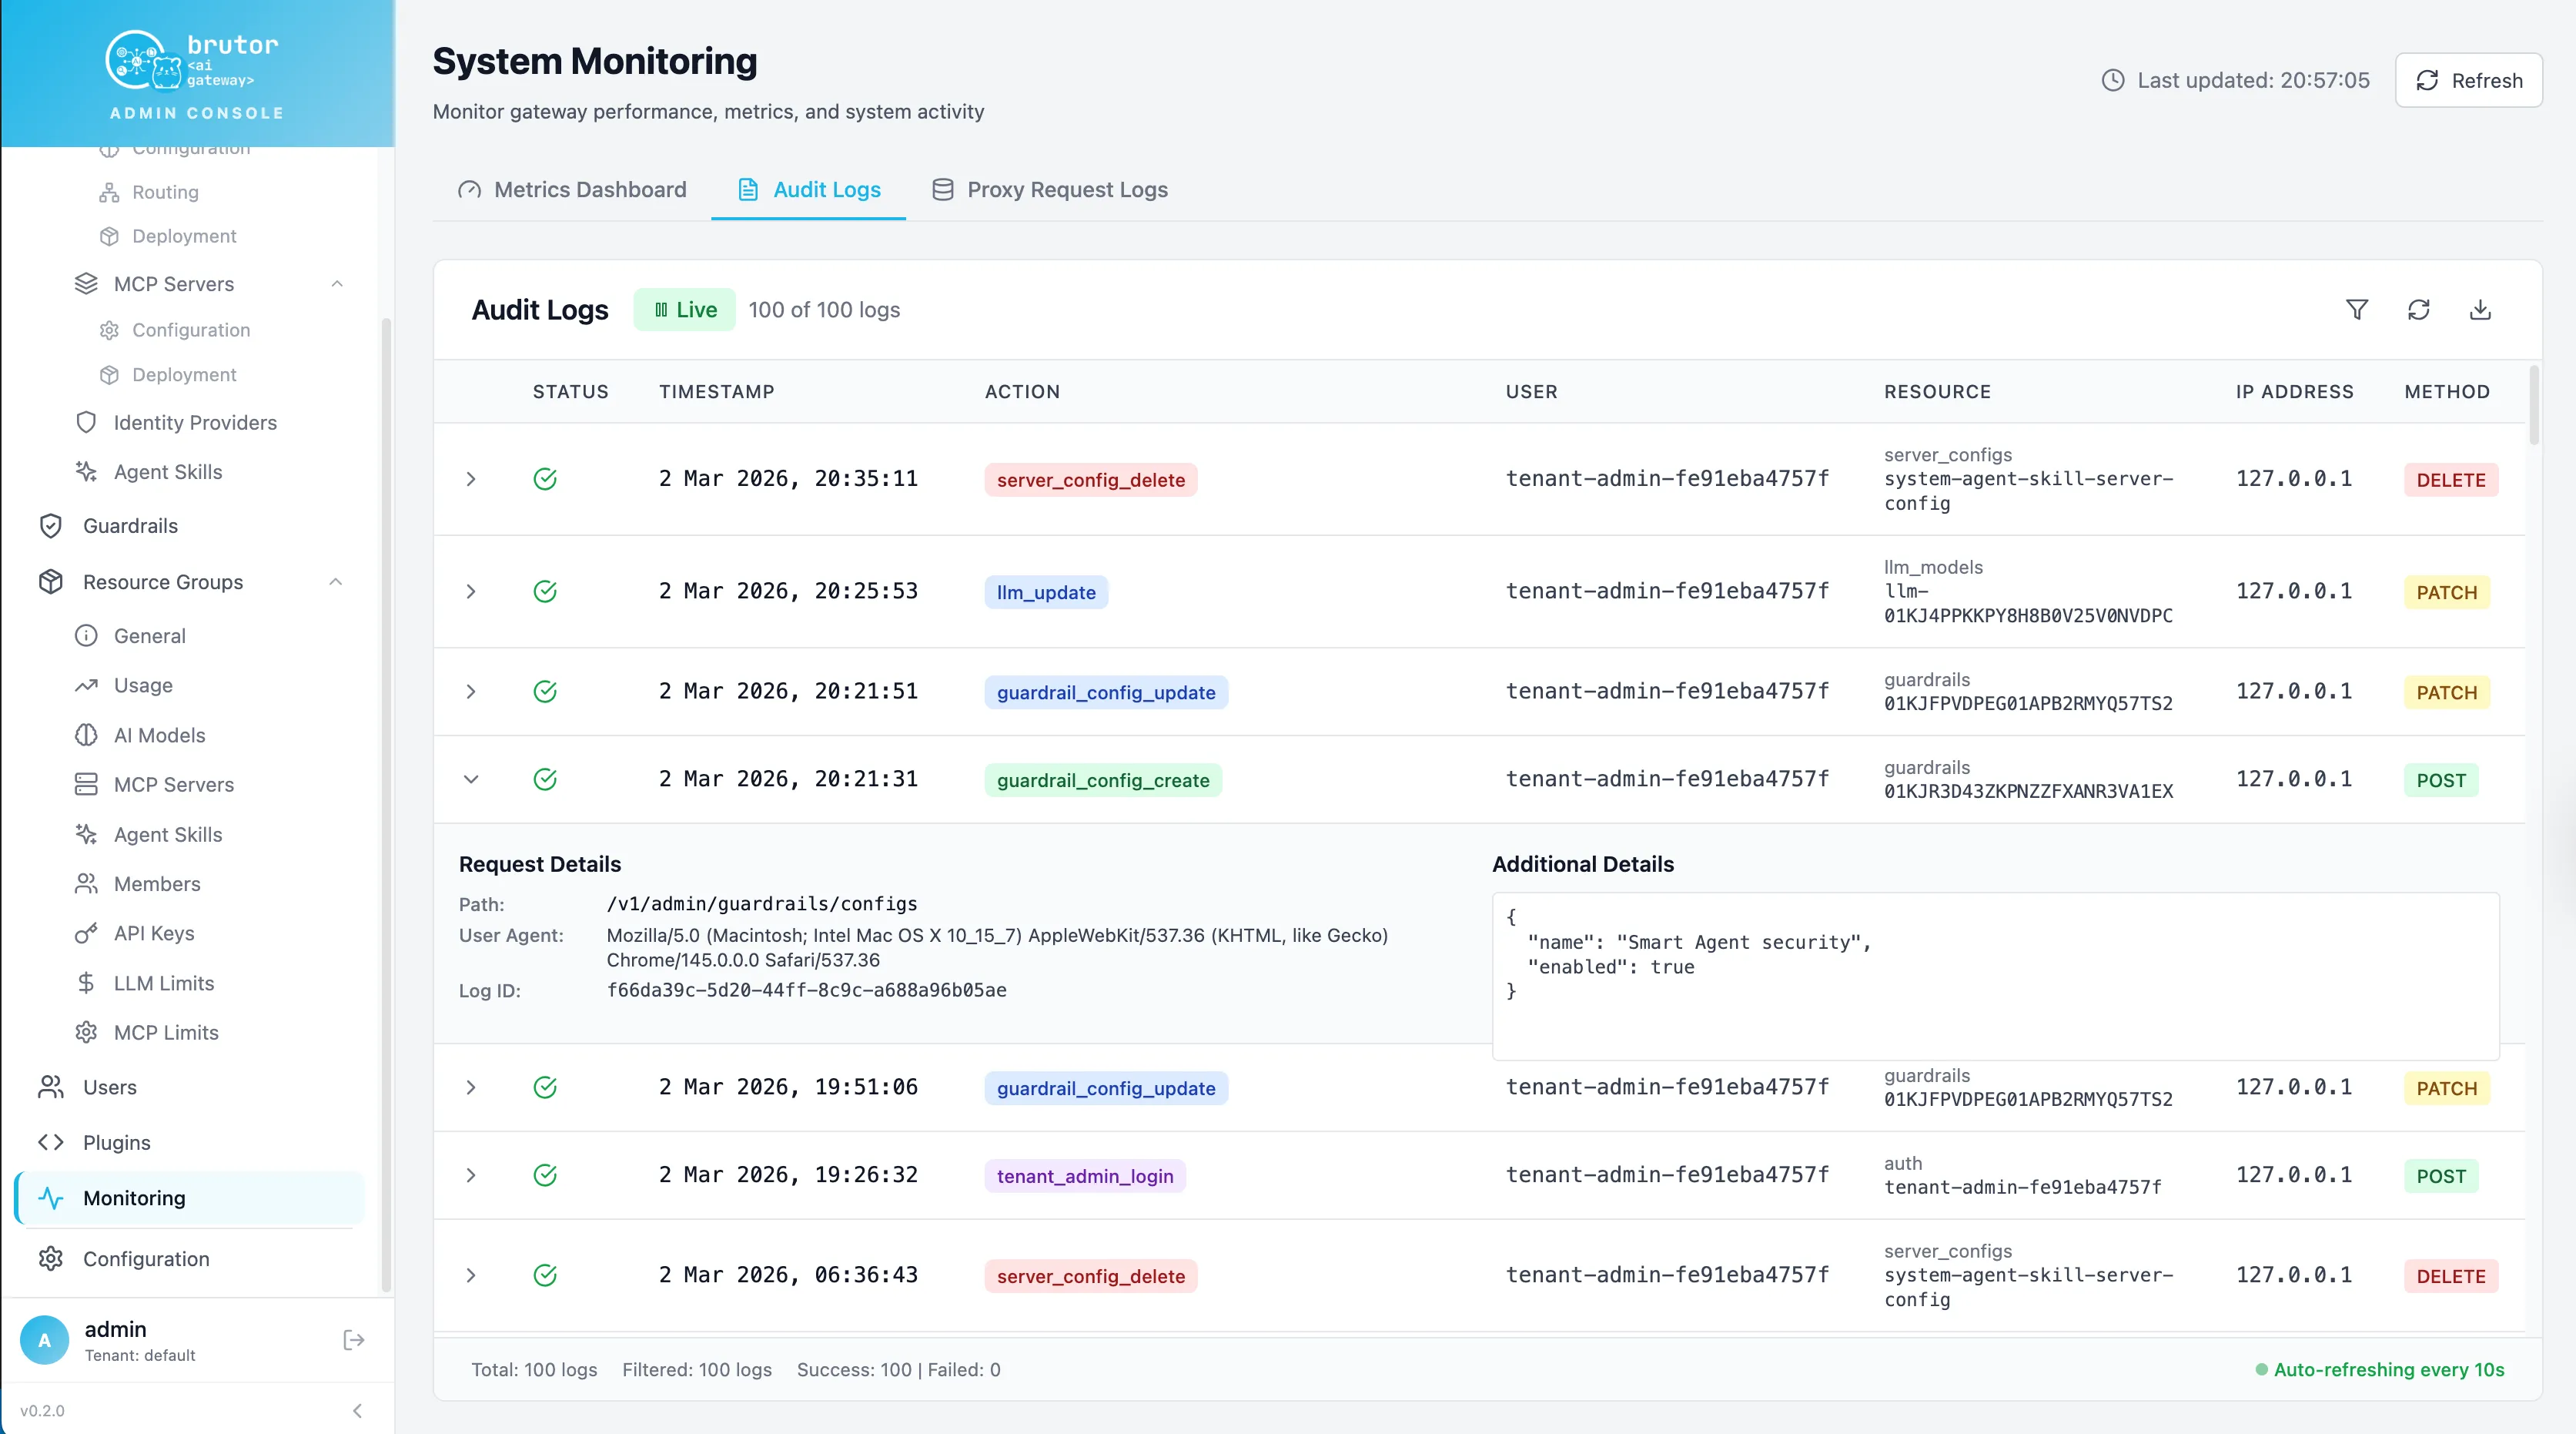
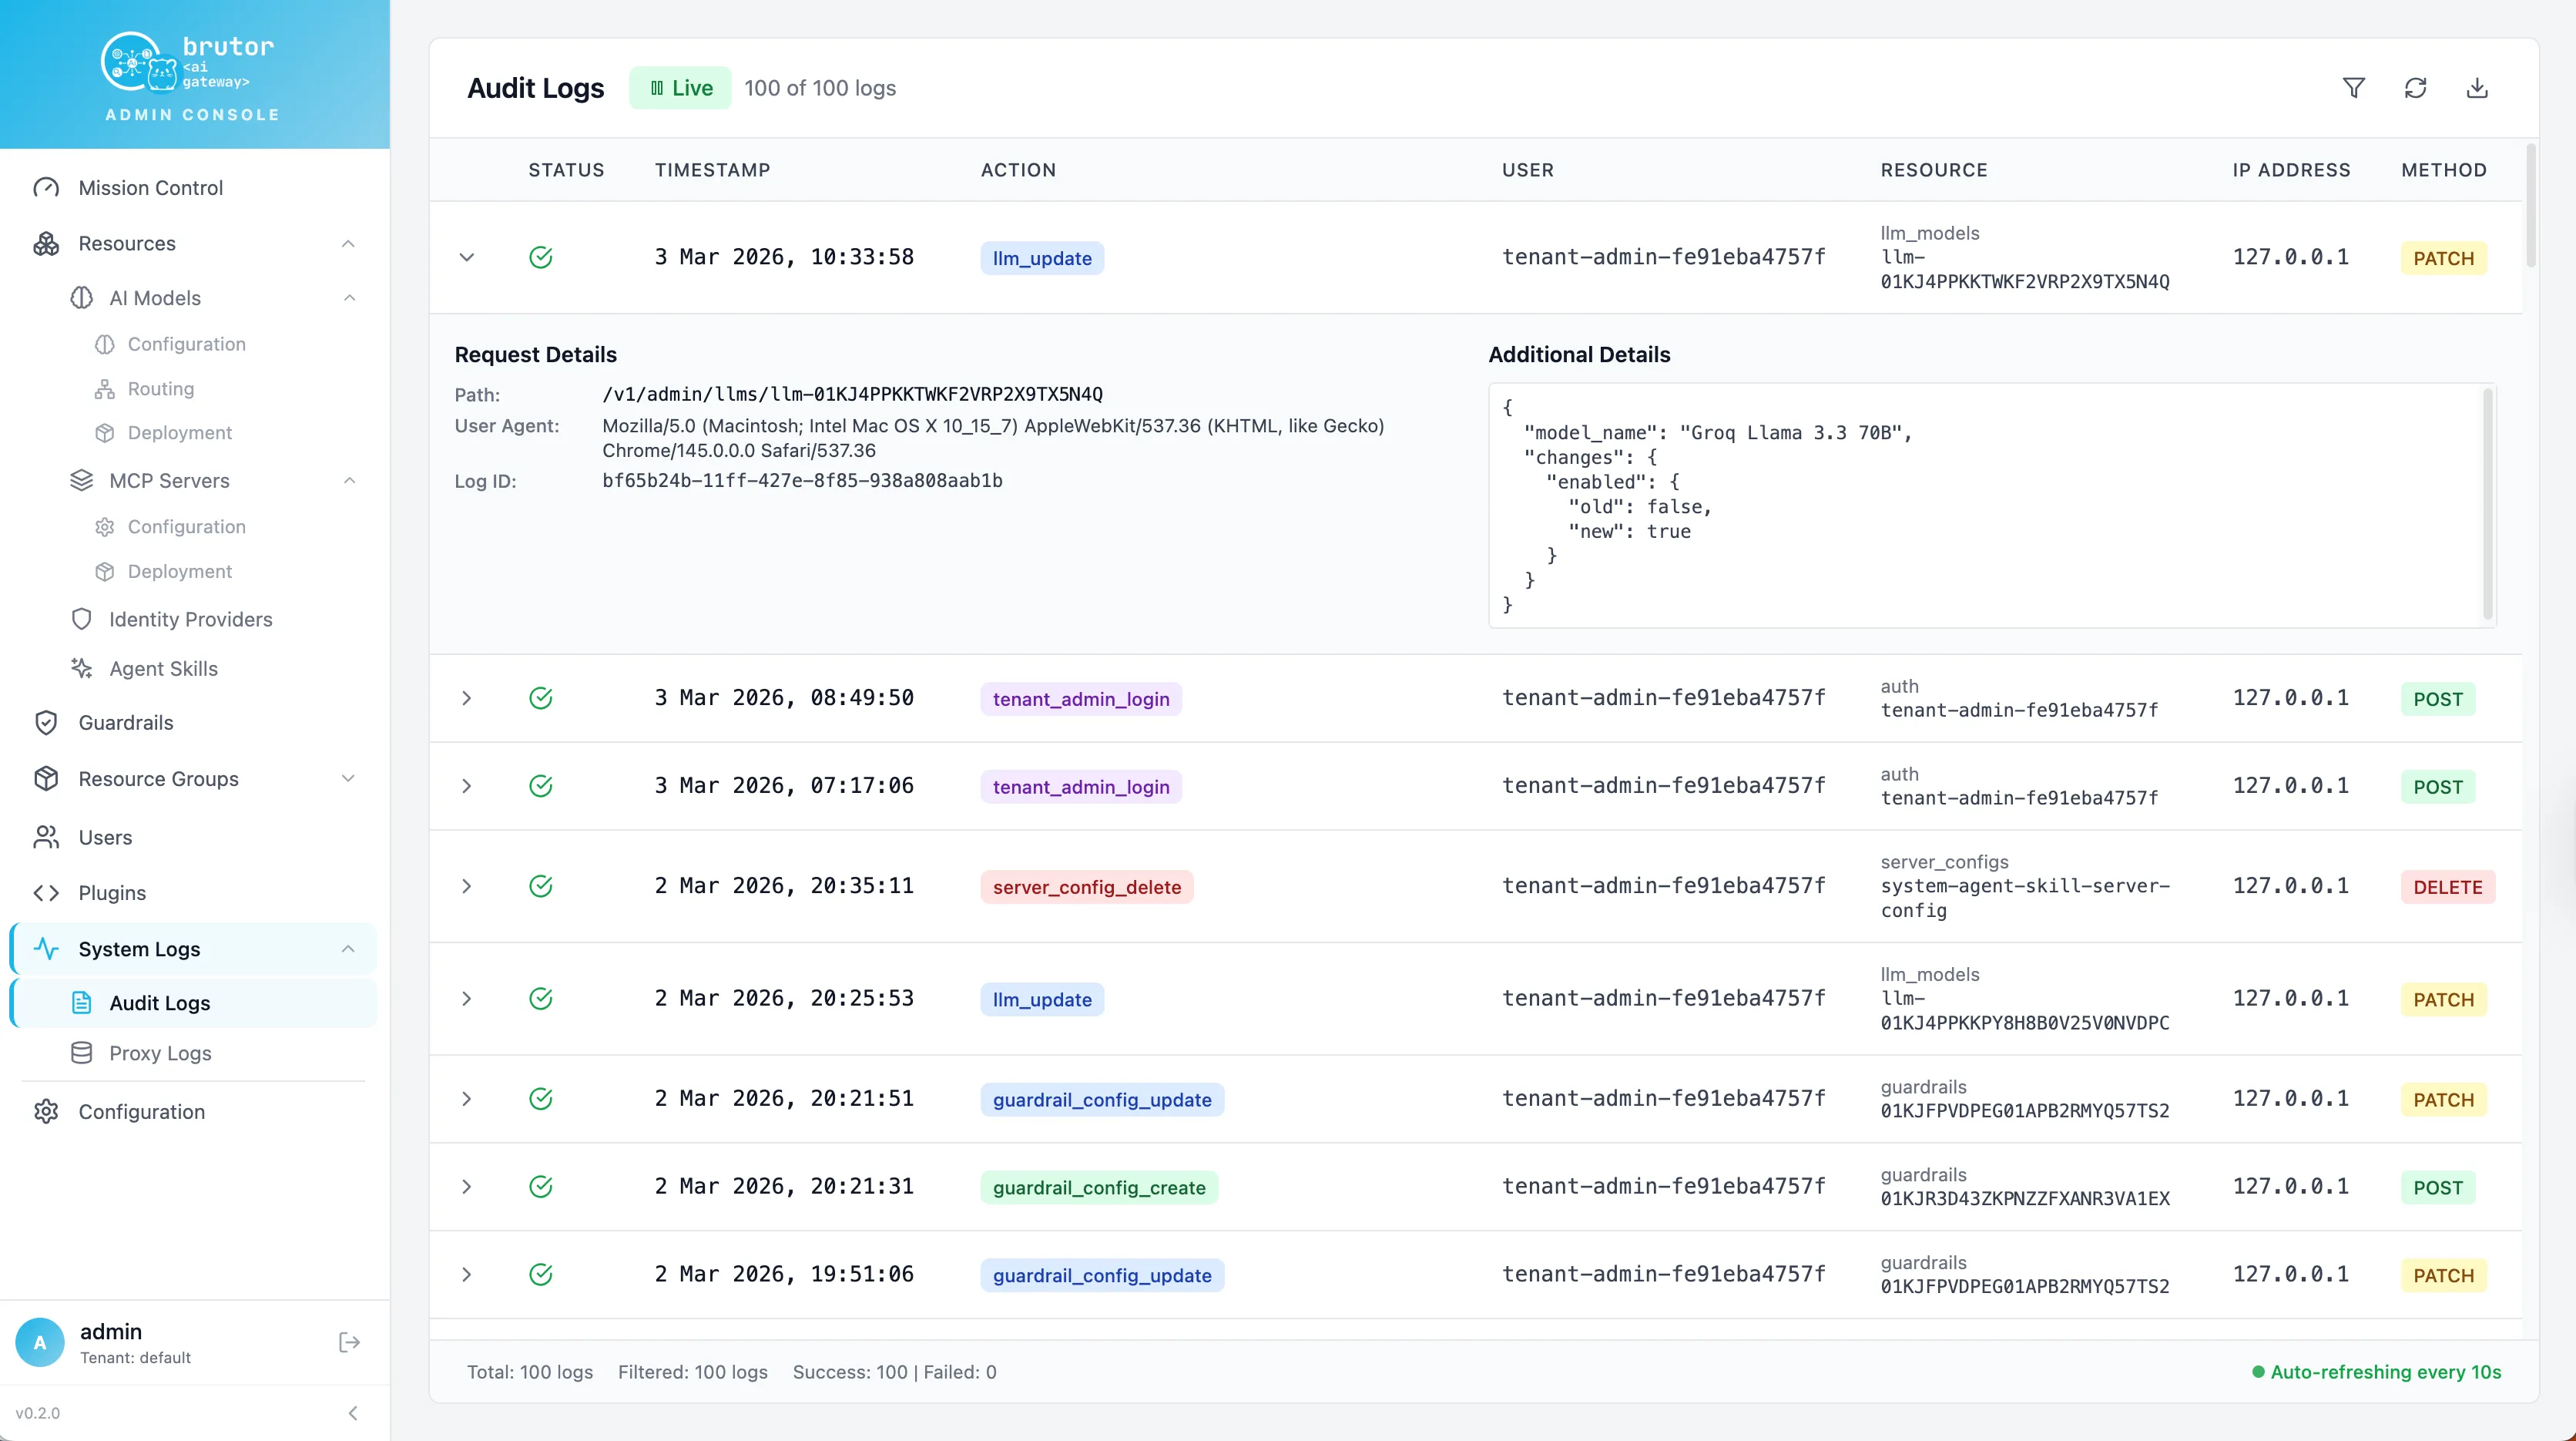
Admin audit log — every Admin API write (create/update/delete of groups, models, guardrails, keys, …) with the acting admin, before/after details, IP and user agent. Viewable under Monitoring → Audit Logs:
-
Governance decisions — enforcement events are audit rows in the proxy-log stream: guardrail blocks, policy denials, approval decisions (
approval_approved/approval_rejected, spliced into the originating request’s trace), residency violations. Each guardrail block writes exactly one audit row — counts in reports match rows in the log one-to-one.
System-operator actions from the operations console (cache flushes, counter resets, log-level changes, …) land in a separate insert-only system_operation_log with before/after state snapshots.
Delivery guarantees and retention
Section titled “Delivery guarantees and retention”Telemetry writes go through bounded in-memory channels with batch consumers (multi-row inserts, up to 500 rows per batch), so logging never blocks the request path. The backpressure policy differs by stream:
- Proxy logs & metrics — best-effort: under extreme sustained load the channel can fill and rows are shed (a drop counter records exactly how many).
- Usage logs — never dropped: when the channel is full the writer waits for capacity. Billing data survives load spikes.
Retention is operator-controlled — prune proxy logs on your own schedule:
curl -X POST http://localhost:5050/v1/admin/proxy-logs/cleanup \ -H "Authorization: Bearer $ADMIN_TOKEN" \ -H "Content-Type: application/json" \ -d '{"days_to_keep": 90}'Related pages
Section titled “Related pages”- Mission Control — the aggregate view over these streams
- Metrics & Grafana — counters and histograms for alerting, without row-level detail
- Compliance — turning tagged rows into auditor-ready reports