

AI Gateway
At the centre of the platform sits the Brutor AI Gateway: a single entry point that your AI systems, MCP/IDE clients and the User Portal all call, and that fronts every AI resource you allow — models, MCP servers, agent skills, knowledge bases and peer agents.
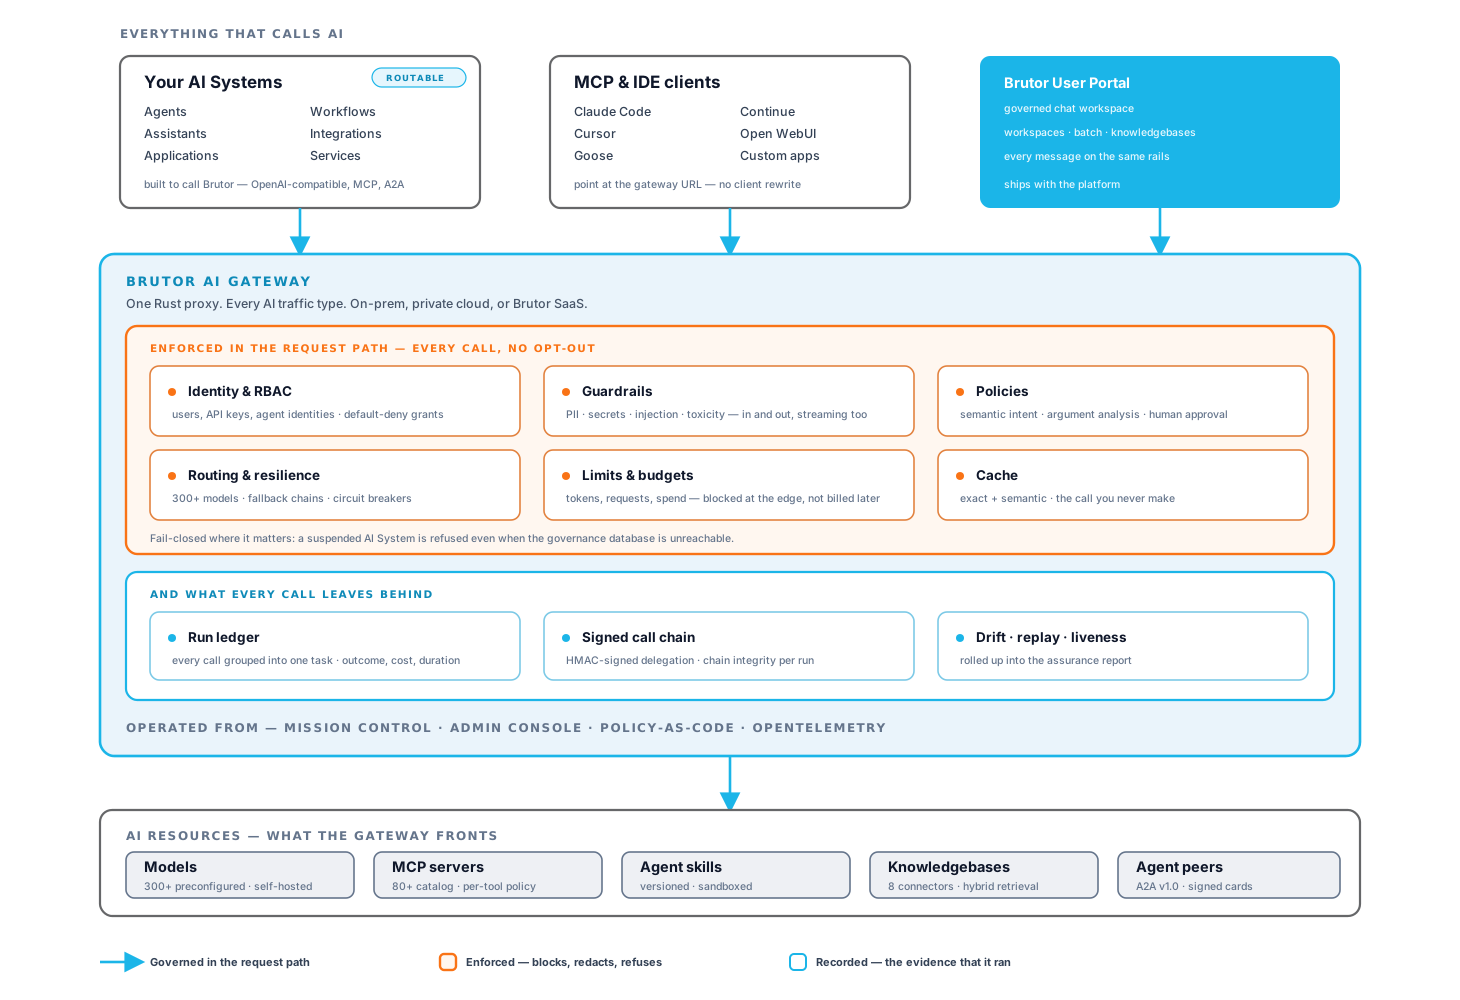
Read the picture in two halves. The enforcement half runs in the request path on every call — it can block, redact or refuse, and there is no opt-out path around it. The evidence half is what every call leaves behind: the run ledger, the signed call chain, and the signals that feed assurance. Governance you can switch off is advice; this is neither optional nor after-the-fact.
Clients don’t change to get this: point an existing OpenAI or Anthropic SDK at the gateway’s base URL and every request is authenticated, policy-checked, metered and logged. The client sees a normal response — governance is invisible until a policy fires.
What runs on every call
Section titled “What runs on every call”Fourteen capabilities sit behind that one hop, in four layers. The assurance layer is what the other three feed; the AI layer is what the gateway fronts; the governance layer is what it enforces; the operations layer is what keeps it affordable and visible.
The request path
Section titled “The request path”What actually happens to one call, gate by gate:
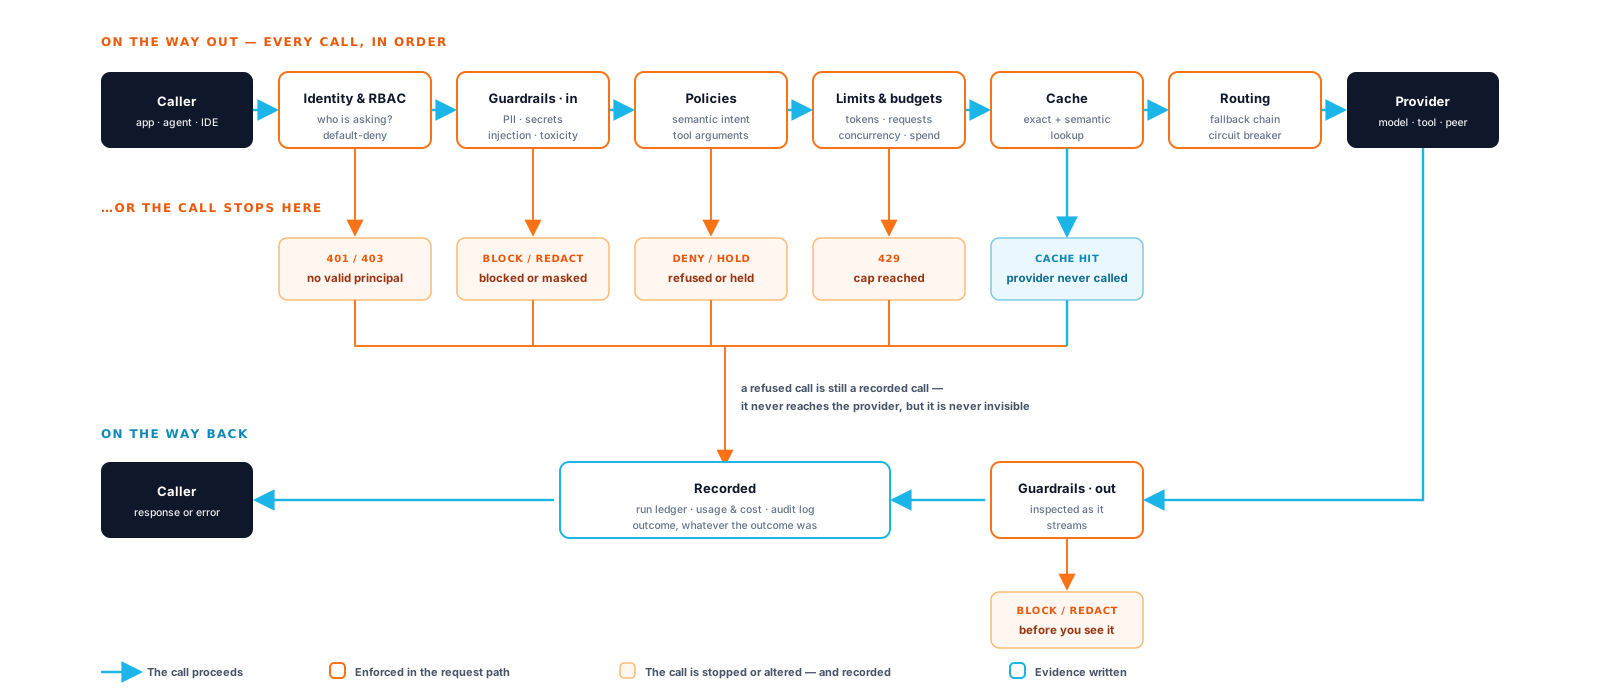
Two properties are worth pausing on:
- Blocked requests short-circuit. A guardrail violation or exceeded budget stops the call at its gate — the provider is never called, no tokens are spent, and the refusal is recorded with the same fidelity as a success.
- Every outcome is evidence. Allowed, cached, redacted, denied, held for approval — each lands in the run ledger, the usage record and the audit log. This is what makes assurance possible without instrumenting your application.
For the deployment view behind this picture — the Rust data plane, the Python config plane, the shared database — see Architecture.
Assurance layer
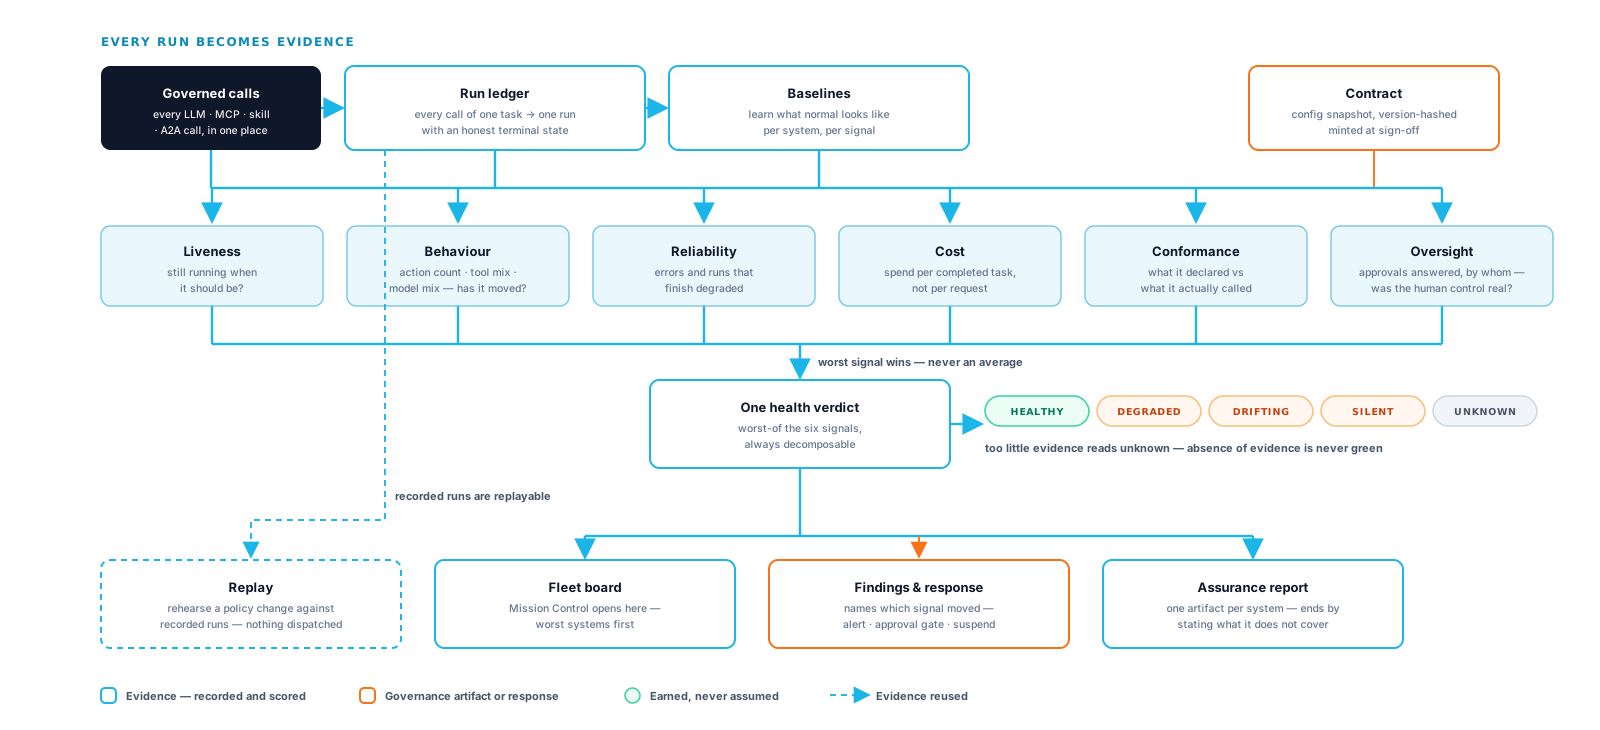
Section titled “Assurance layer”Most gateways stop at the call. Assurance is the layer that answers the question a per-request dashboard cannot: is this AI System still doing its job, the way it was approved? It is built entirely from what enforcement already recorded, so nothing has to be instrumented in your application.
The run ledger
Section titled “The run ledger”The calls that make up one task, across models, tools, skills and delegated agents, are grouped into a single run with an honest terminal state. Open one and the actions appear in order, with what each cost and how long it took.
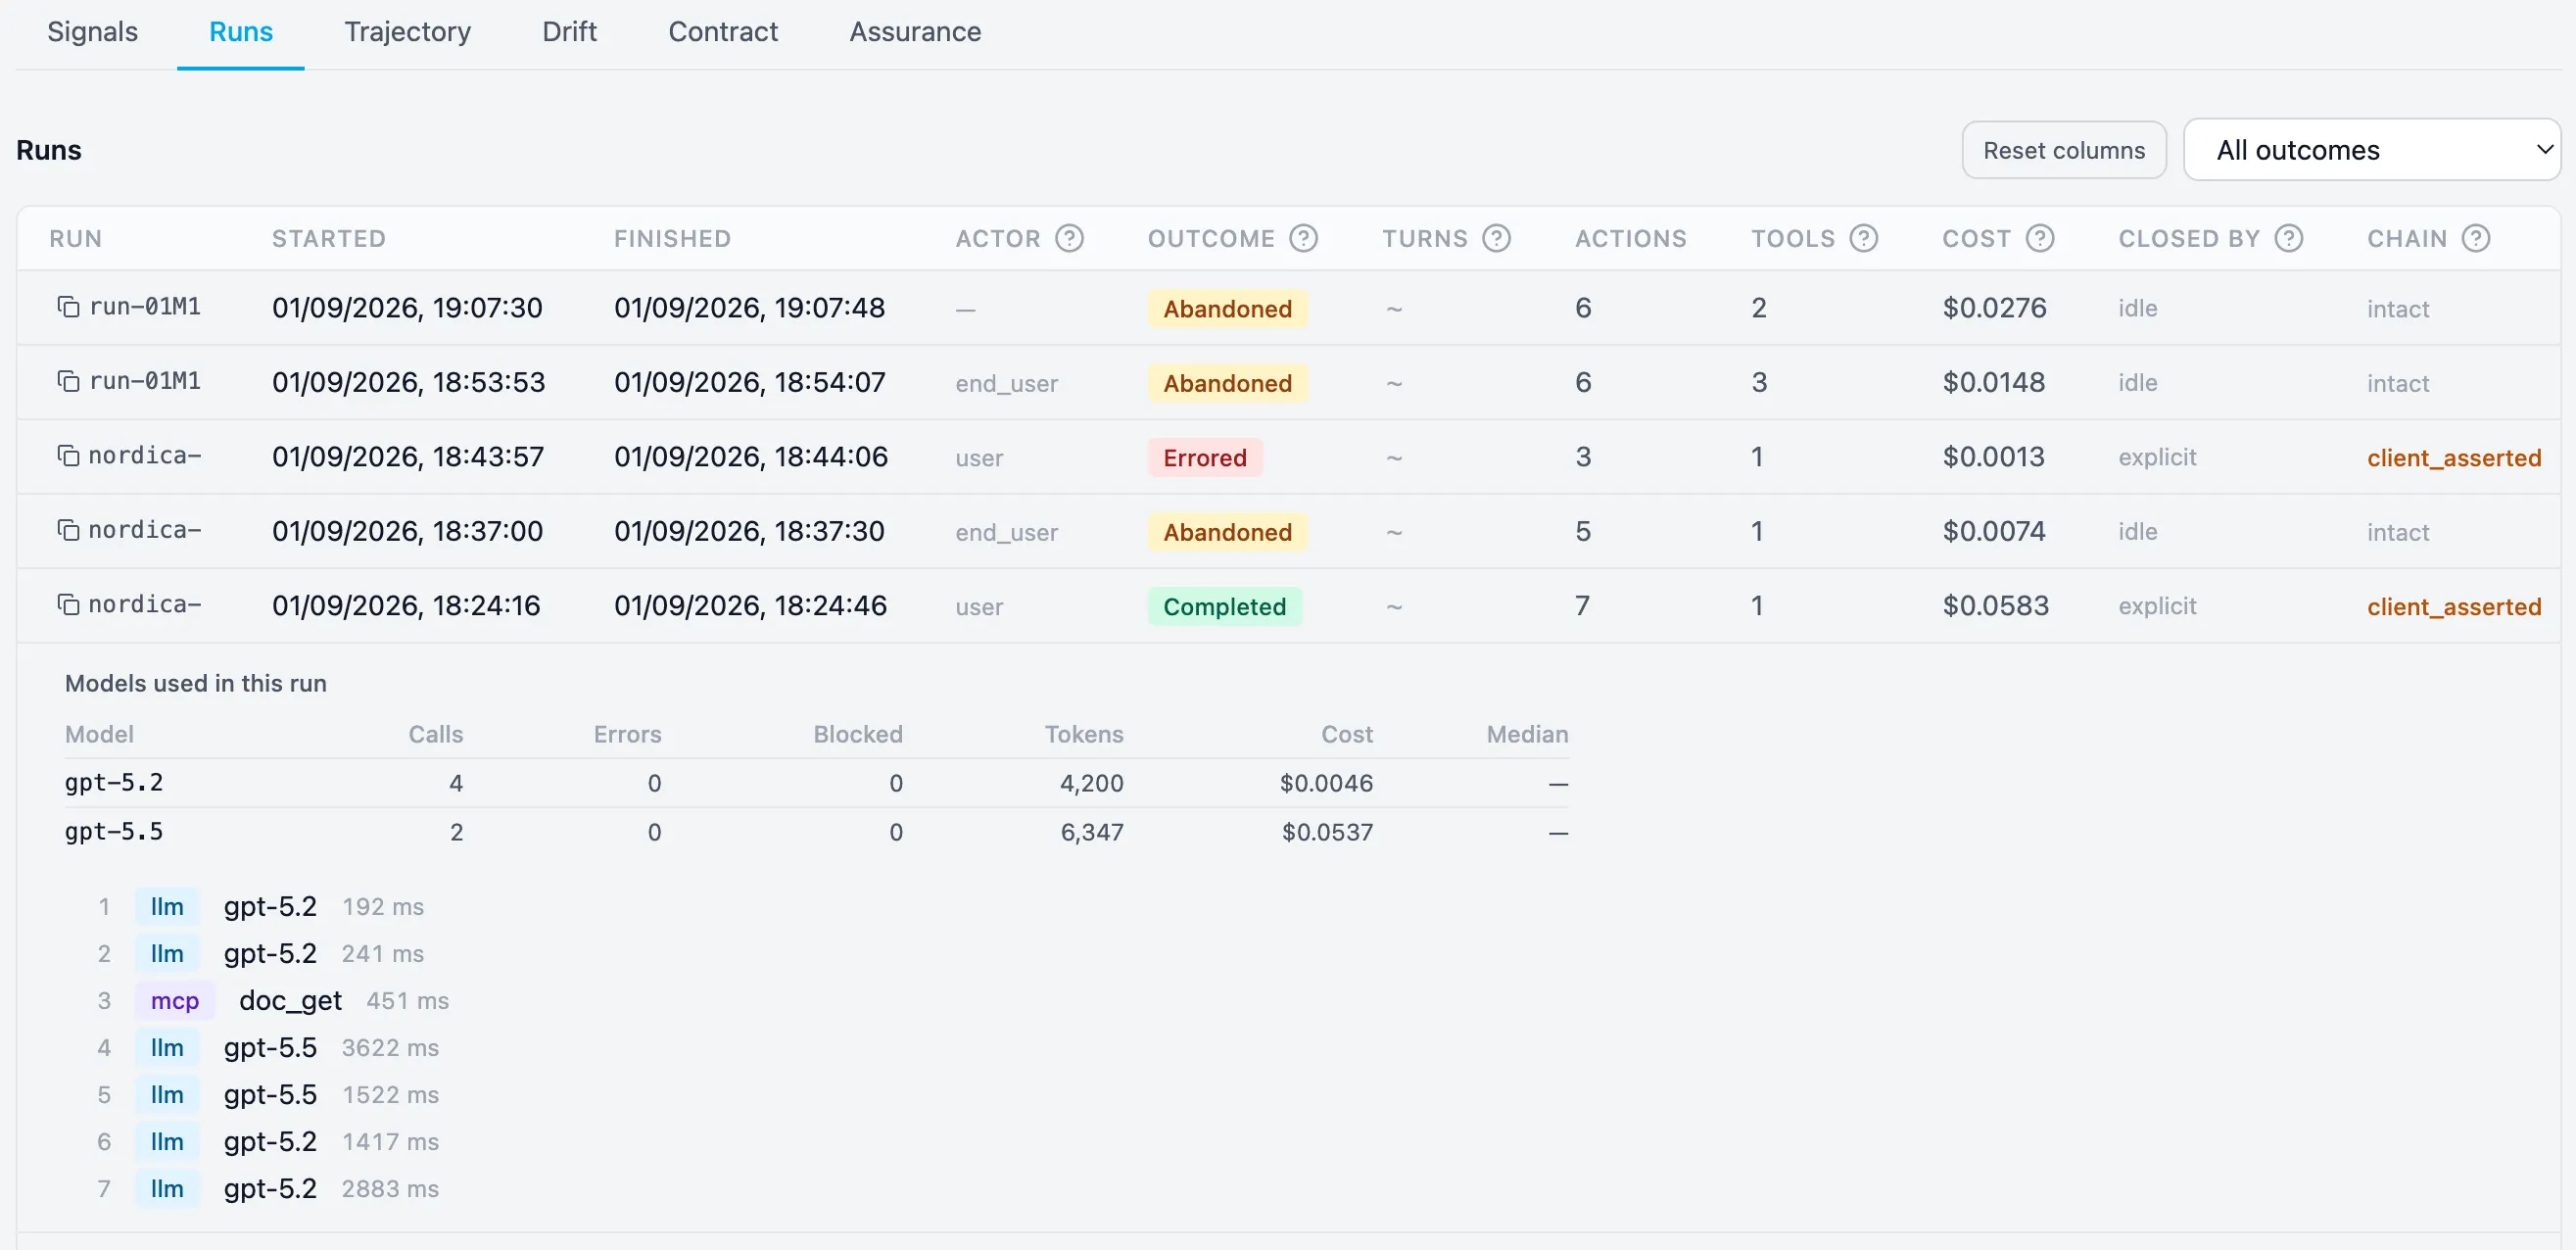
Two columns there matter more than they look. Closed by separates a run the client finished from one an idle timeout closed, and chain distinguishes a gateway-signed execution chain from one the client merely asserted, which is the difference between witnessed and reported evidence.
Signals, learned per system
Section titled “Signals, learned per system”Each signal is scored against the system’s own baseline rather than a threshold you guessed, and each shows its current figure, its distribution and its shape over time, so “cost went up” resolves into a step change, a slow drift or one bad afternoon.
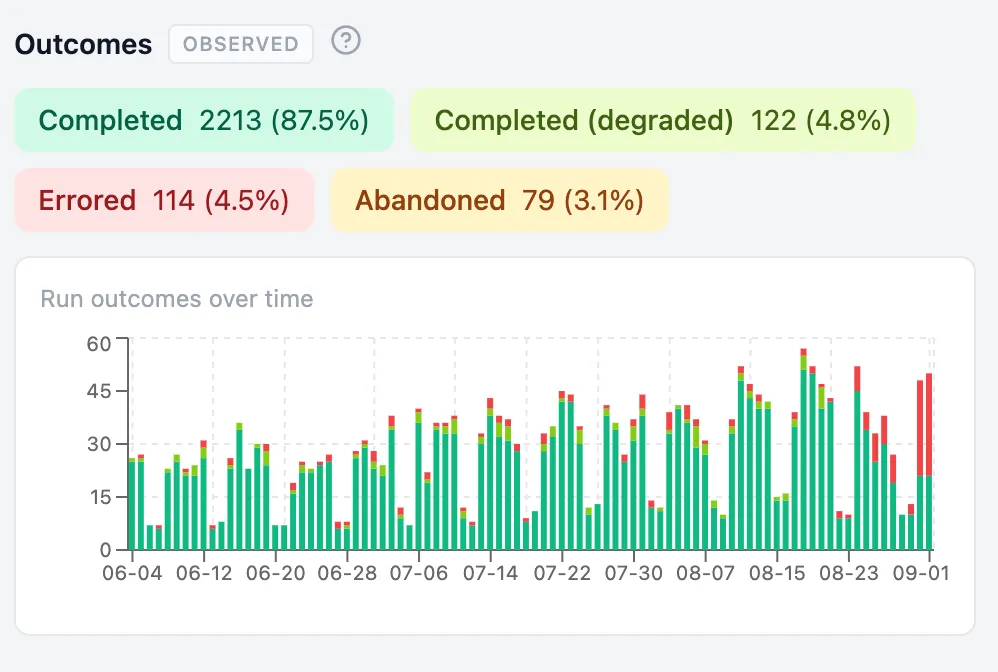
Outcomes separate finished work from work that merely stopped:
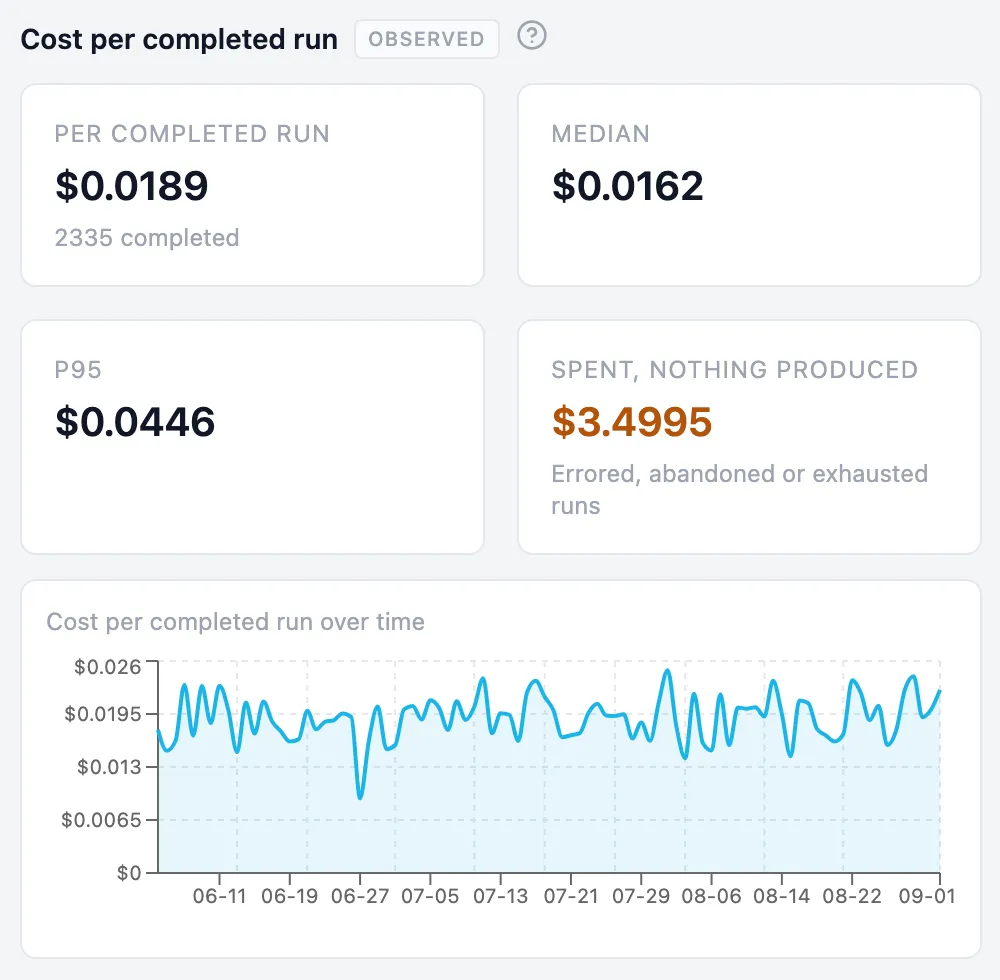
Cost per completed run prices the work that actually produced something, and calls out the spend that produced nothing at all:
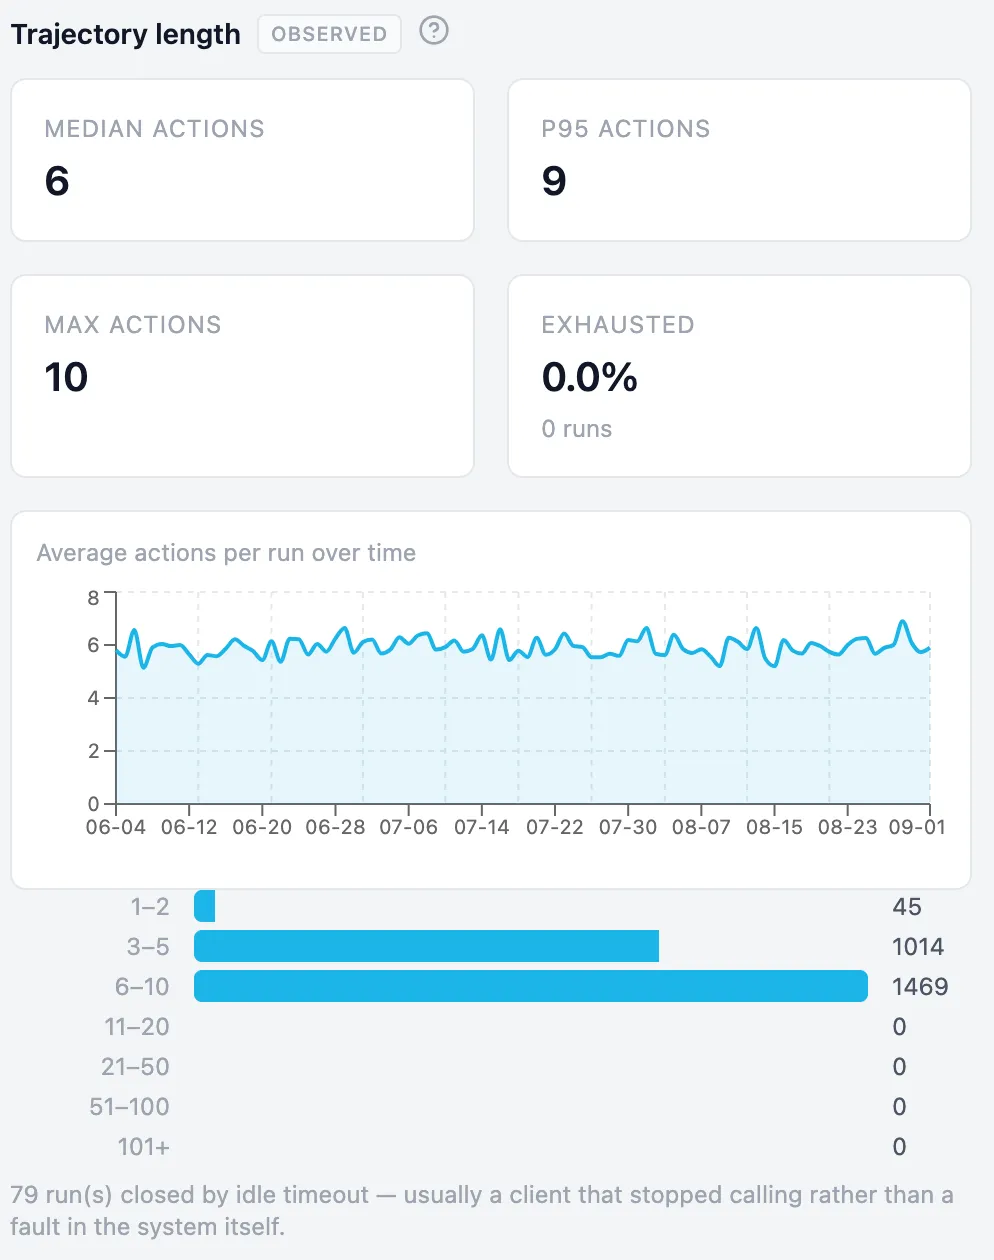
Trajectory length shows how many actions a task takes, and whether any run is hitting its ceiling:
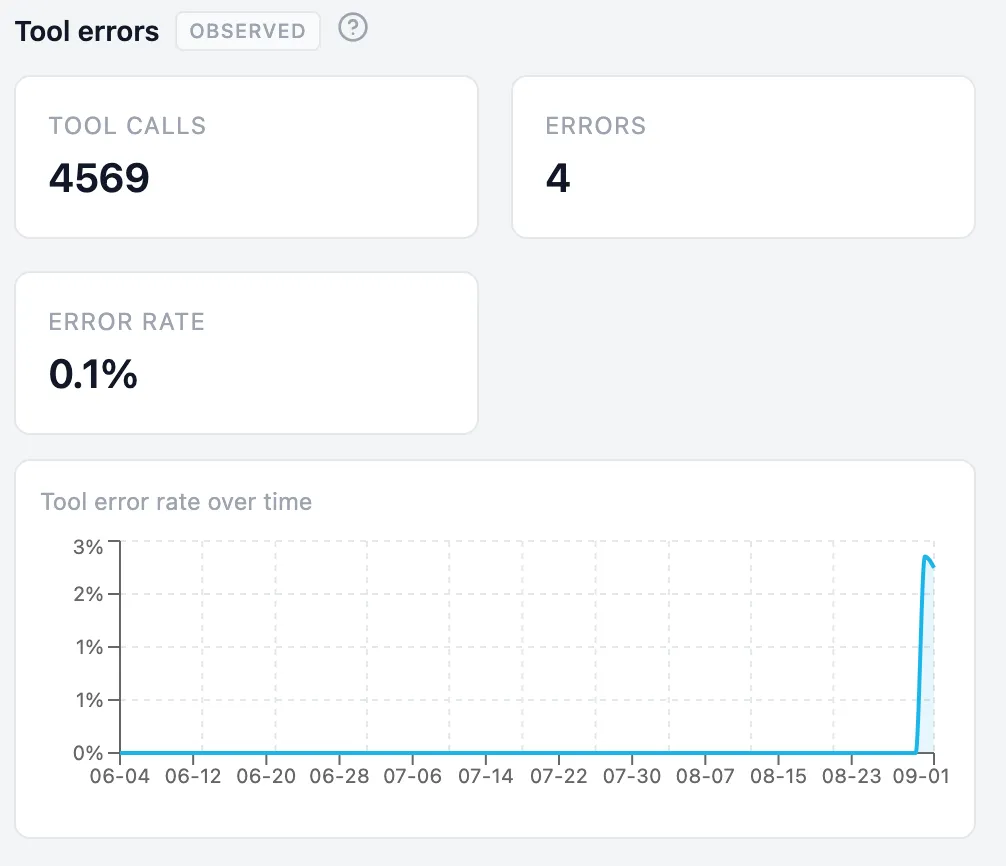
Tool errors track the half of an agent’s work that is not the model:
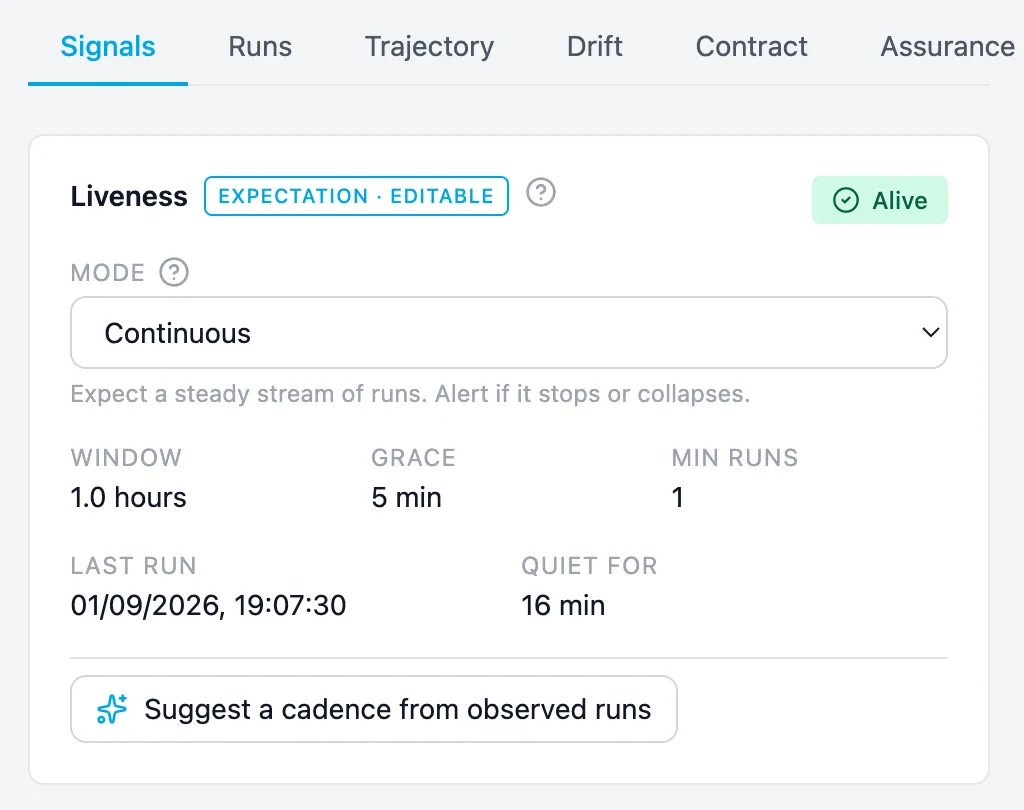
Liveness is the only signal that fires when traffic stops. Rather than asking you to invent an expectation, Brutor can propose a cadence from the runs it has already seen:
Continuous checks
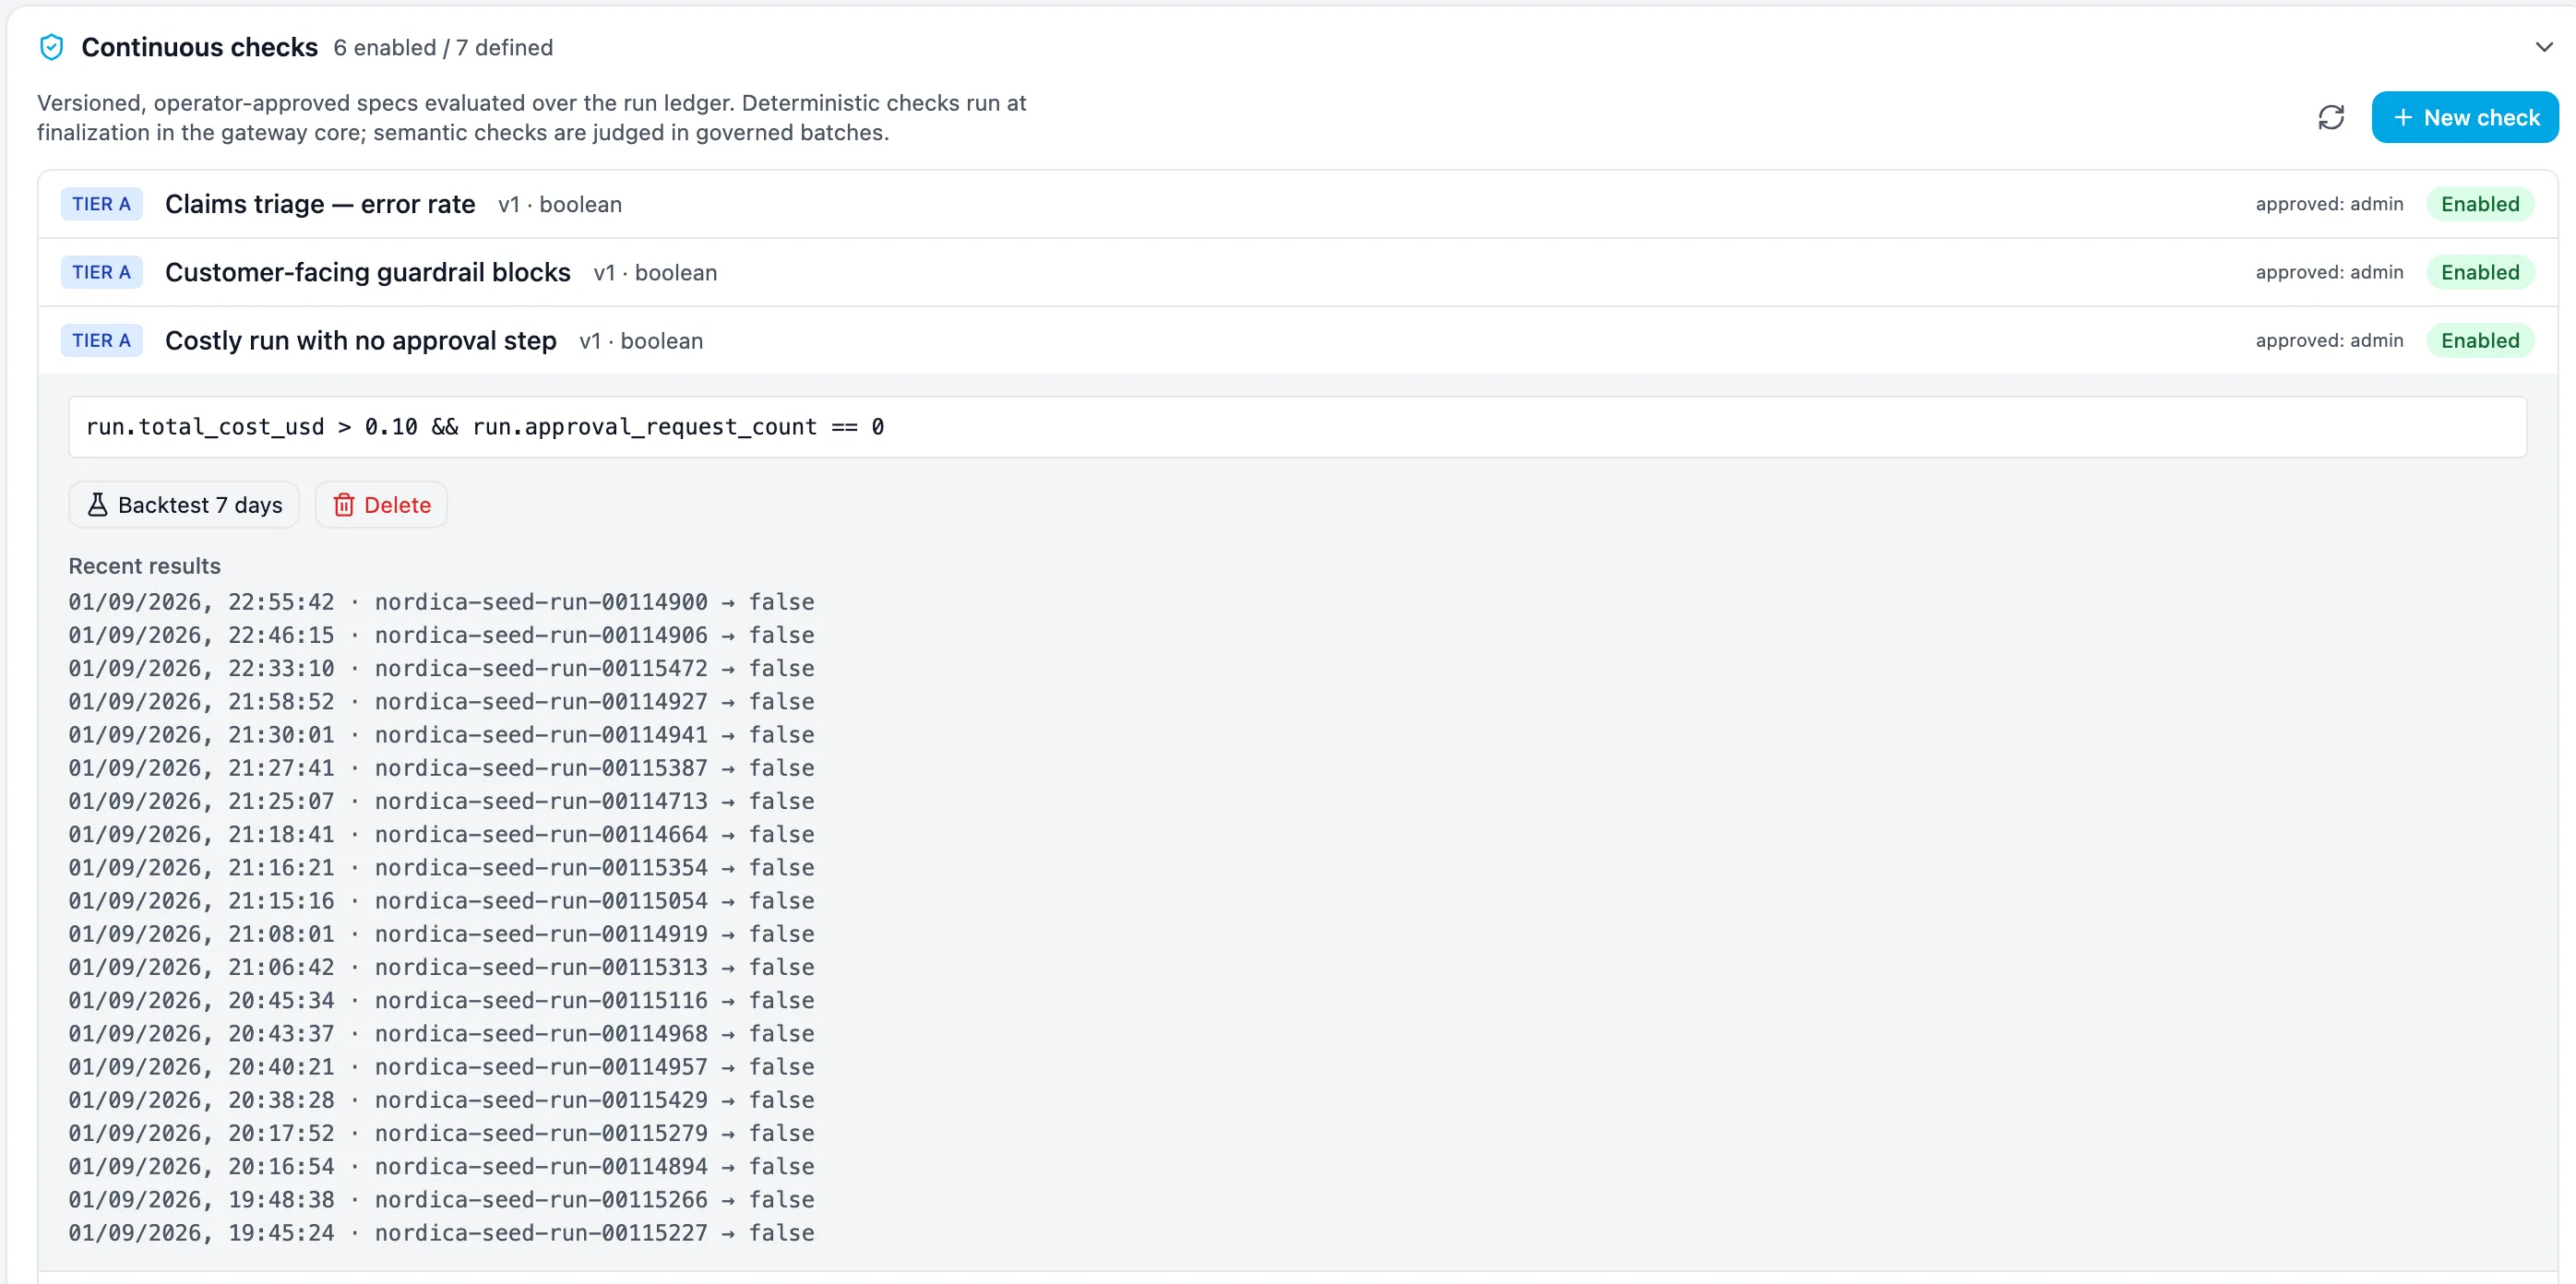
Section titled “Continuous checks”Signals describe behaviour in general. Checks are your own conditions, written once, versioned, approved by an operator and then evaluated over every run. Deterministic ones run in the gateway core as a run finalizes:
Checks that need judgement rather than arithmetic are written in plain language and evaluated by a governed judge model on a declared sample of runs:
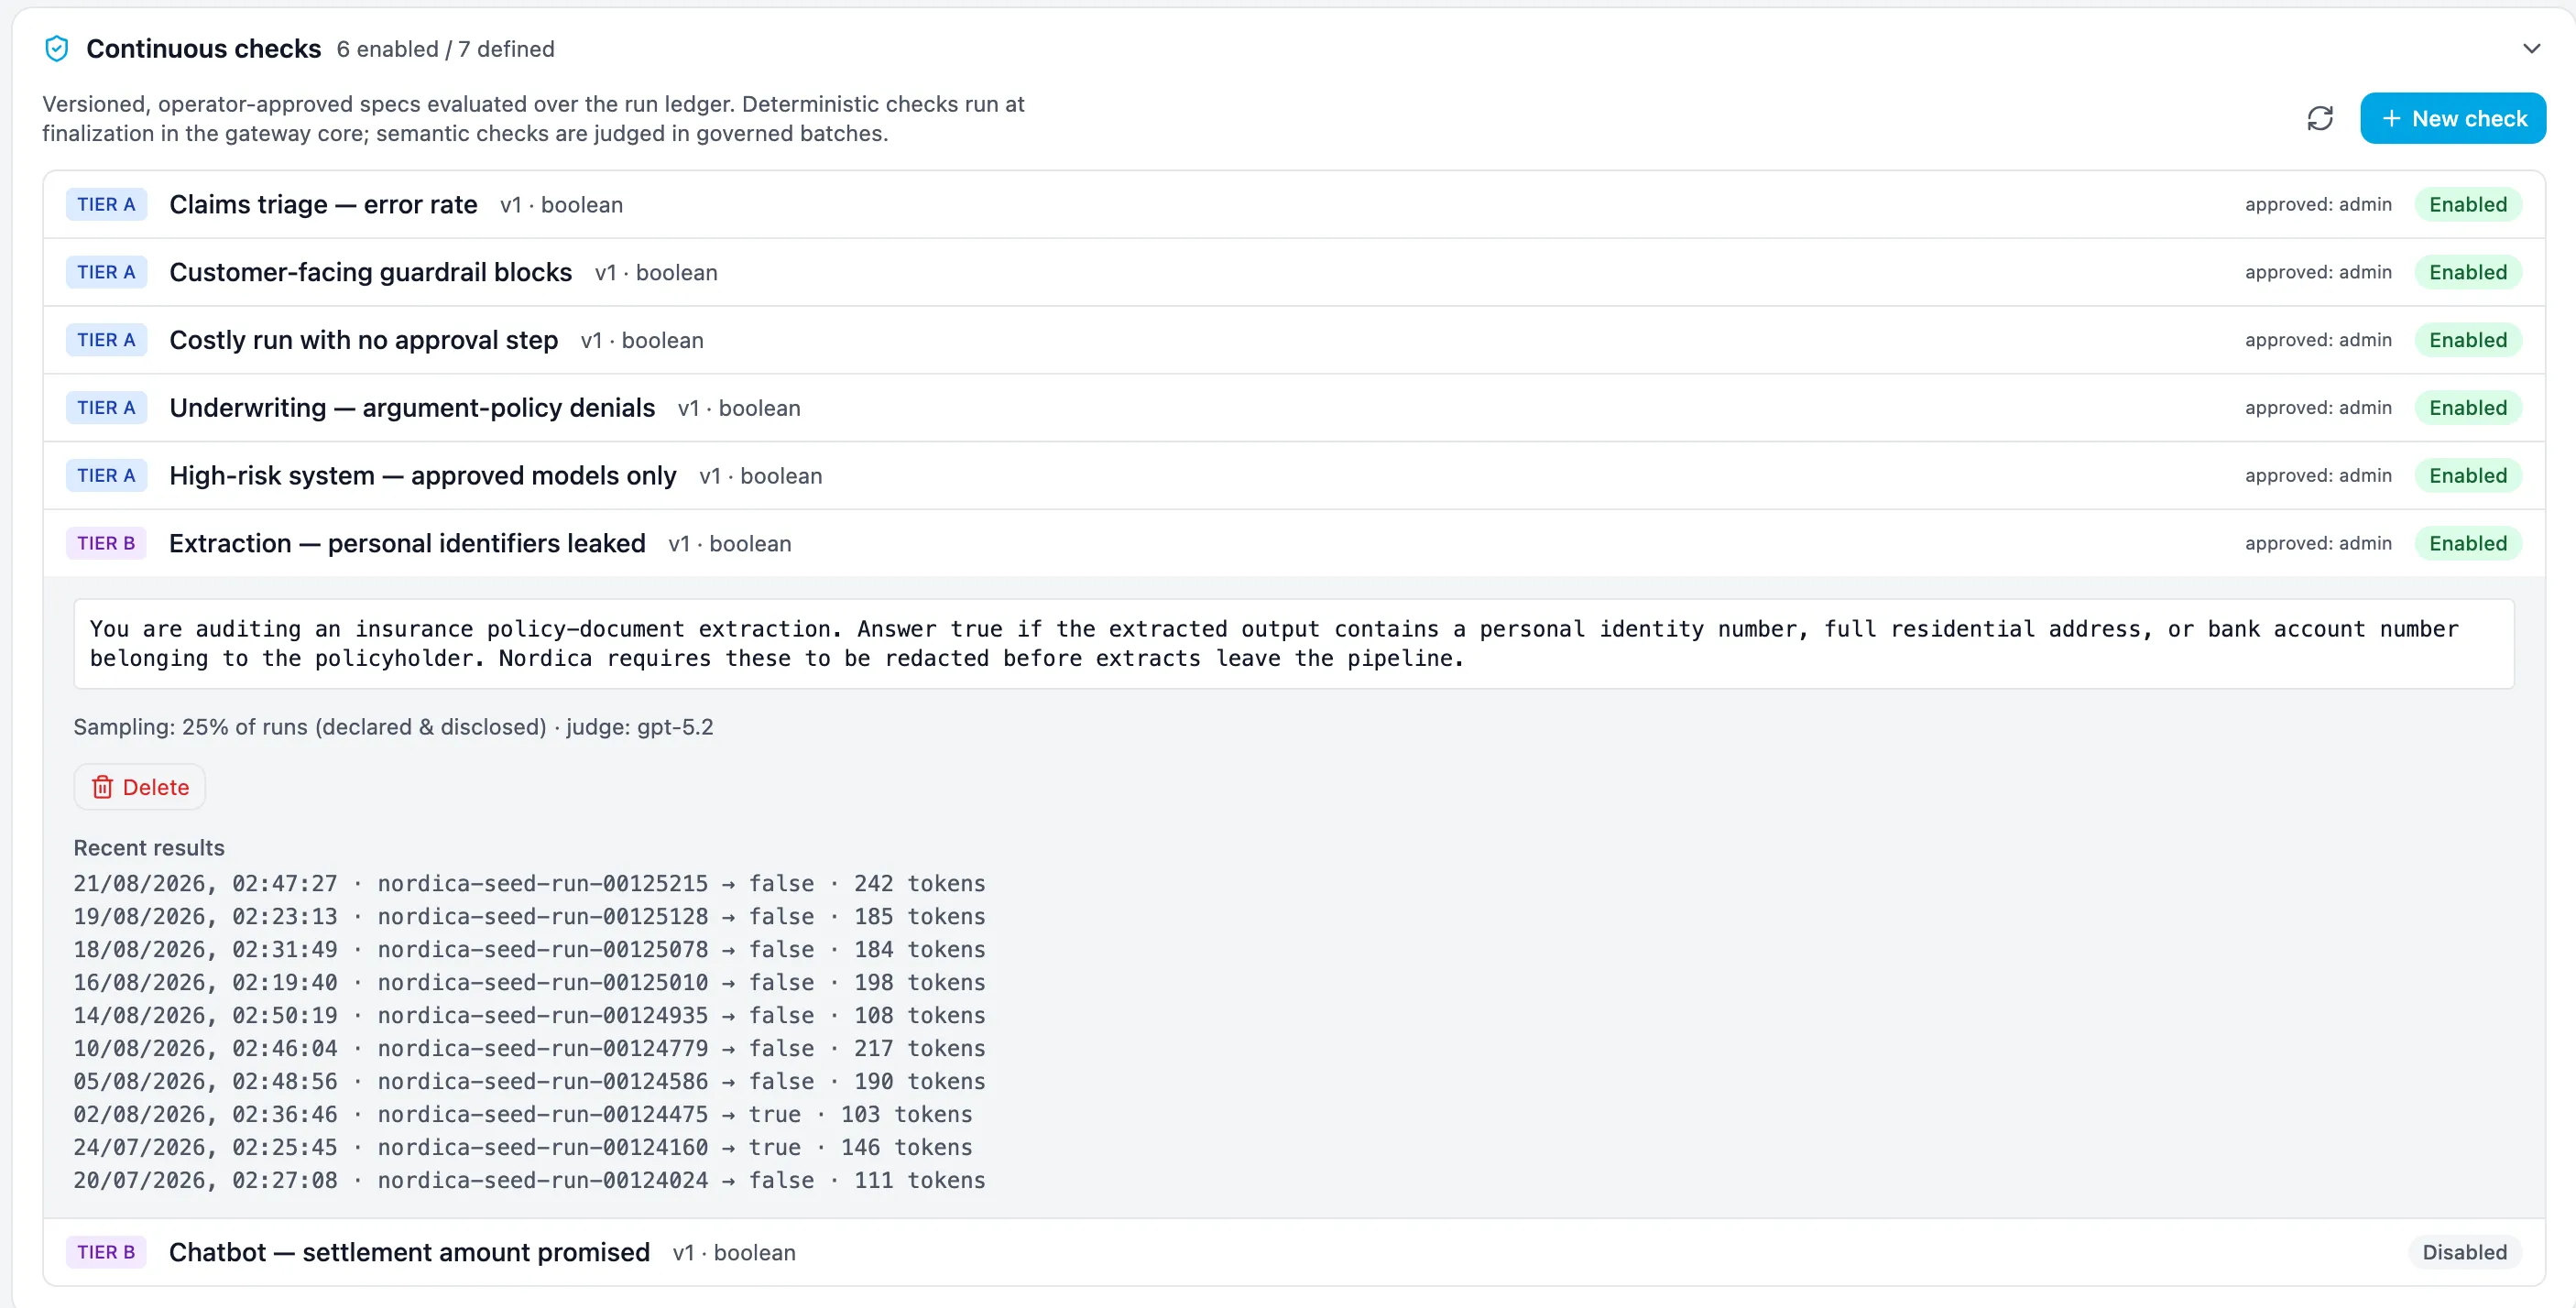
The sampling rate and the judge are stated on the check itself, because a check that inspects a quarter of runs should never be read as covering all of them.
The inbox, and what happens next
Section titled “The inbox, and what happens next”Findings from every source land in one Assurance Inbox with a severity and a state, so detection becomes a queue somebody works rather than a dashboard nobody opens. An open critical finding older than the review SLA is itself a health signal.
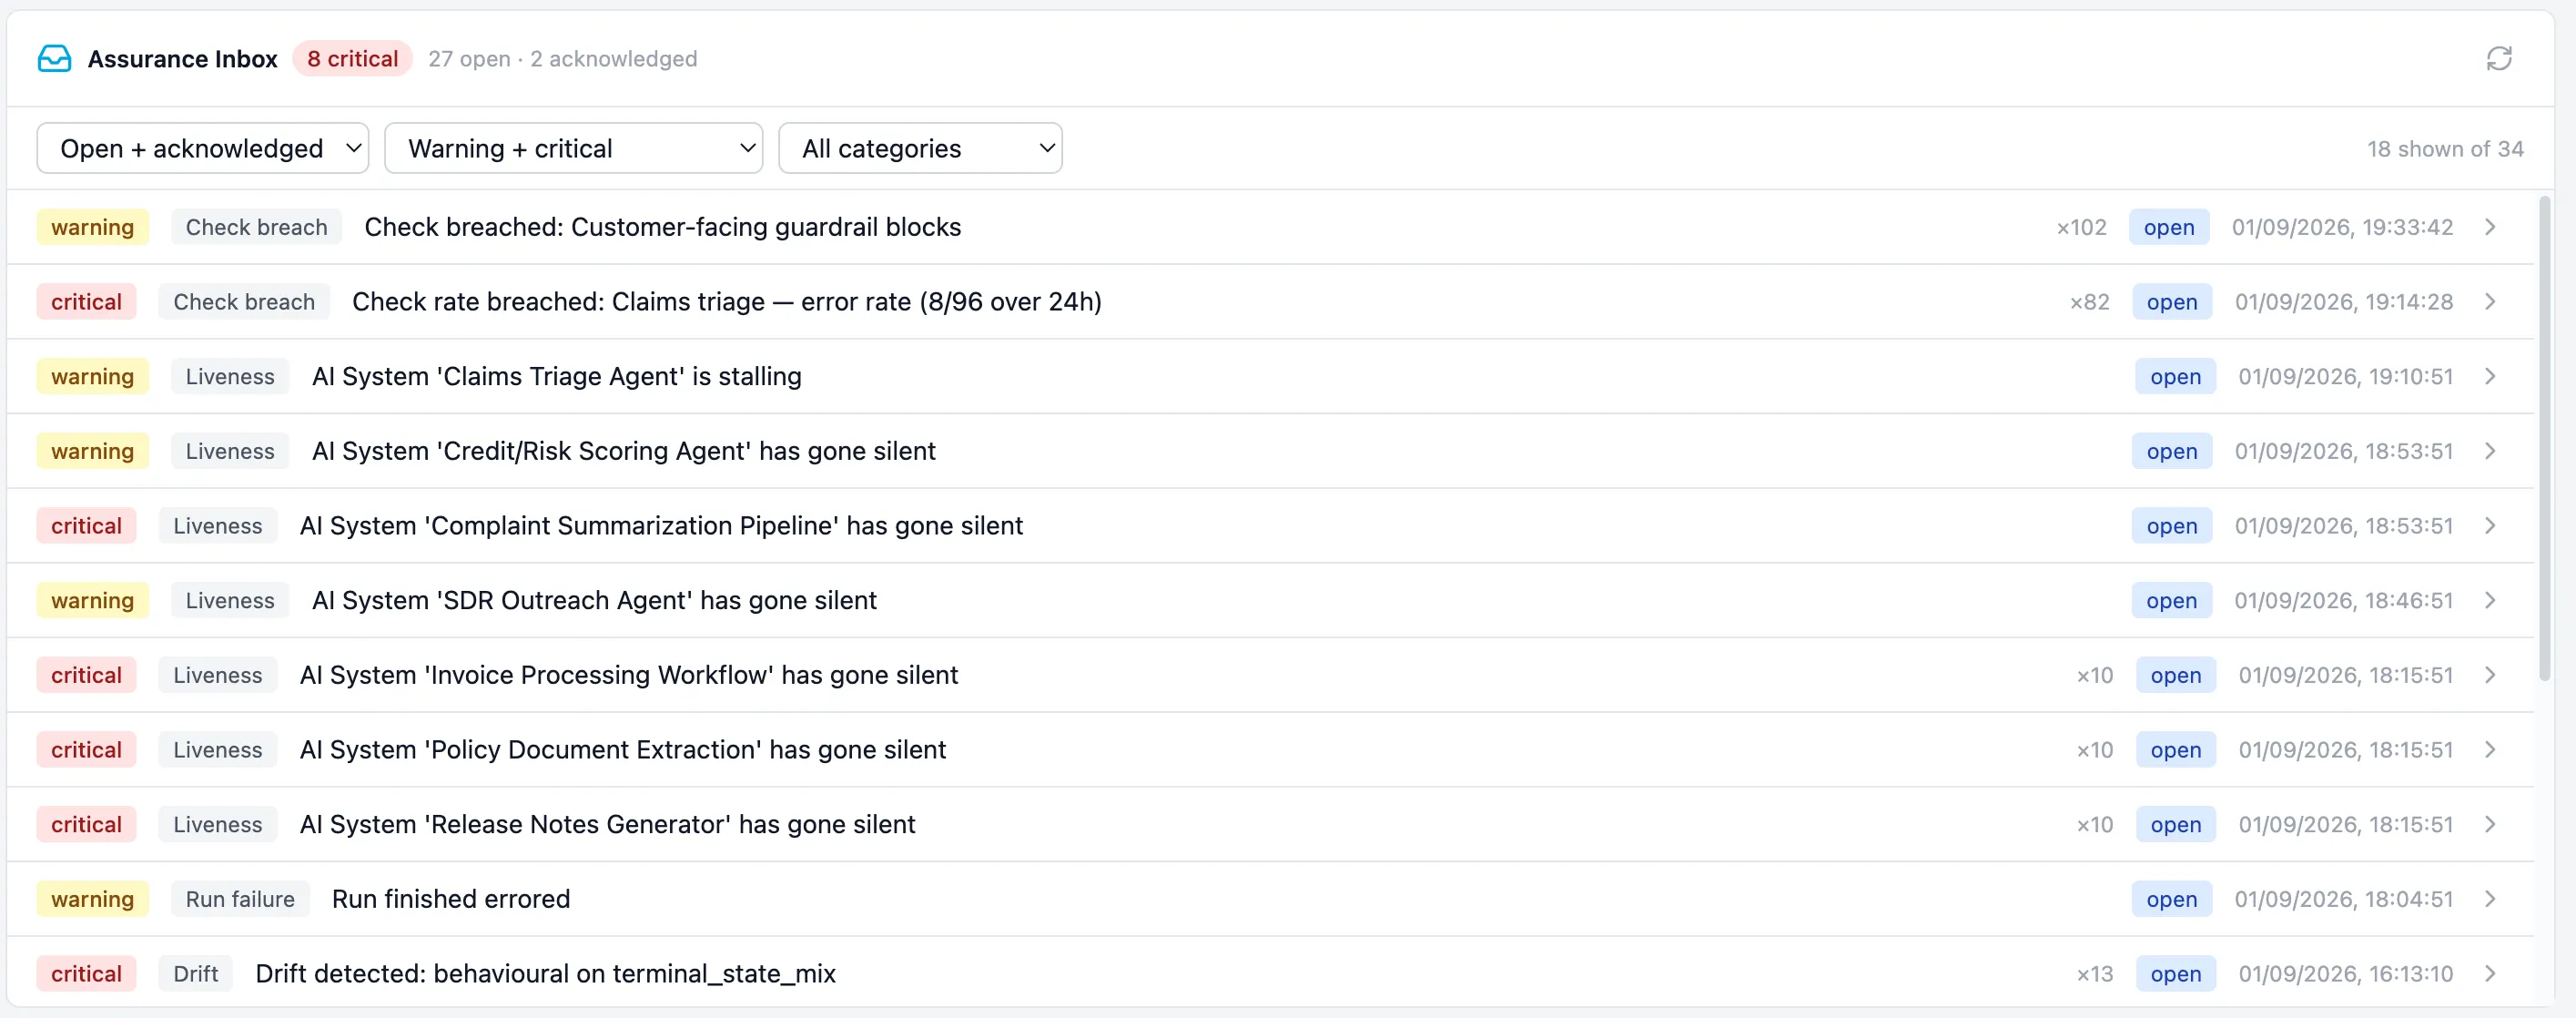
From there the response is graduated through the system’s autonomy level rather than a single kill switch: tighten a limit, require approval, restrict, or suspend while a human investigates. A single misbehaving run can be stopped on its own.
The contract
Section titled “The contract”A contract is generated from resolved live configuration and pinned by hash, never authored by hand, because a policy document that can disagree with reality is worse than none. Each version expands to show exactly what it froze:
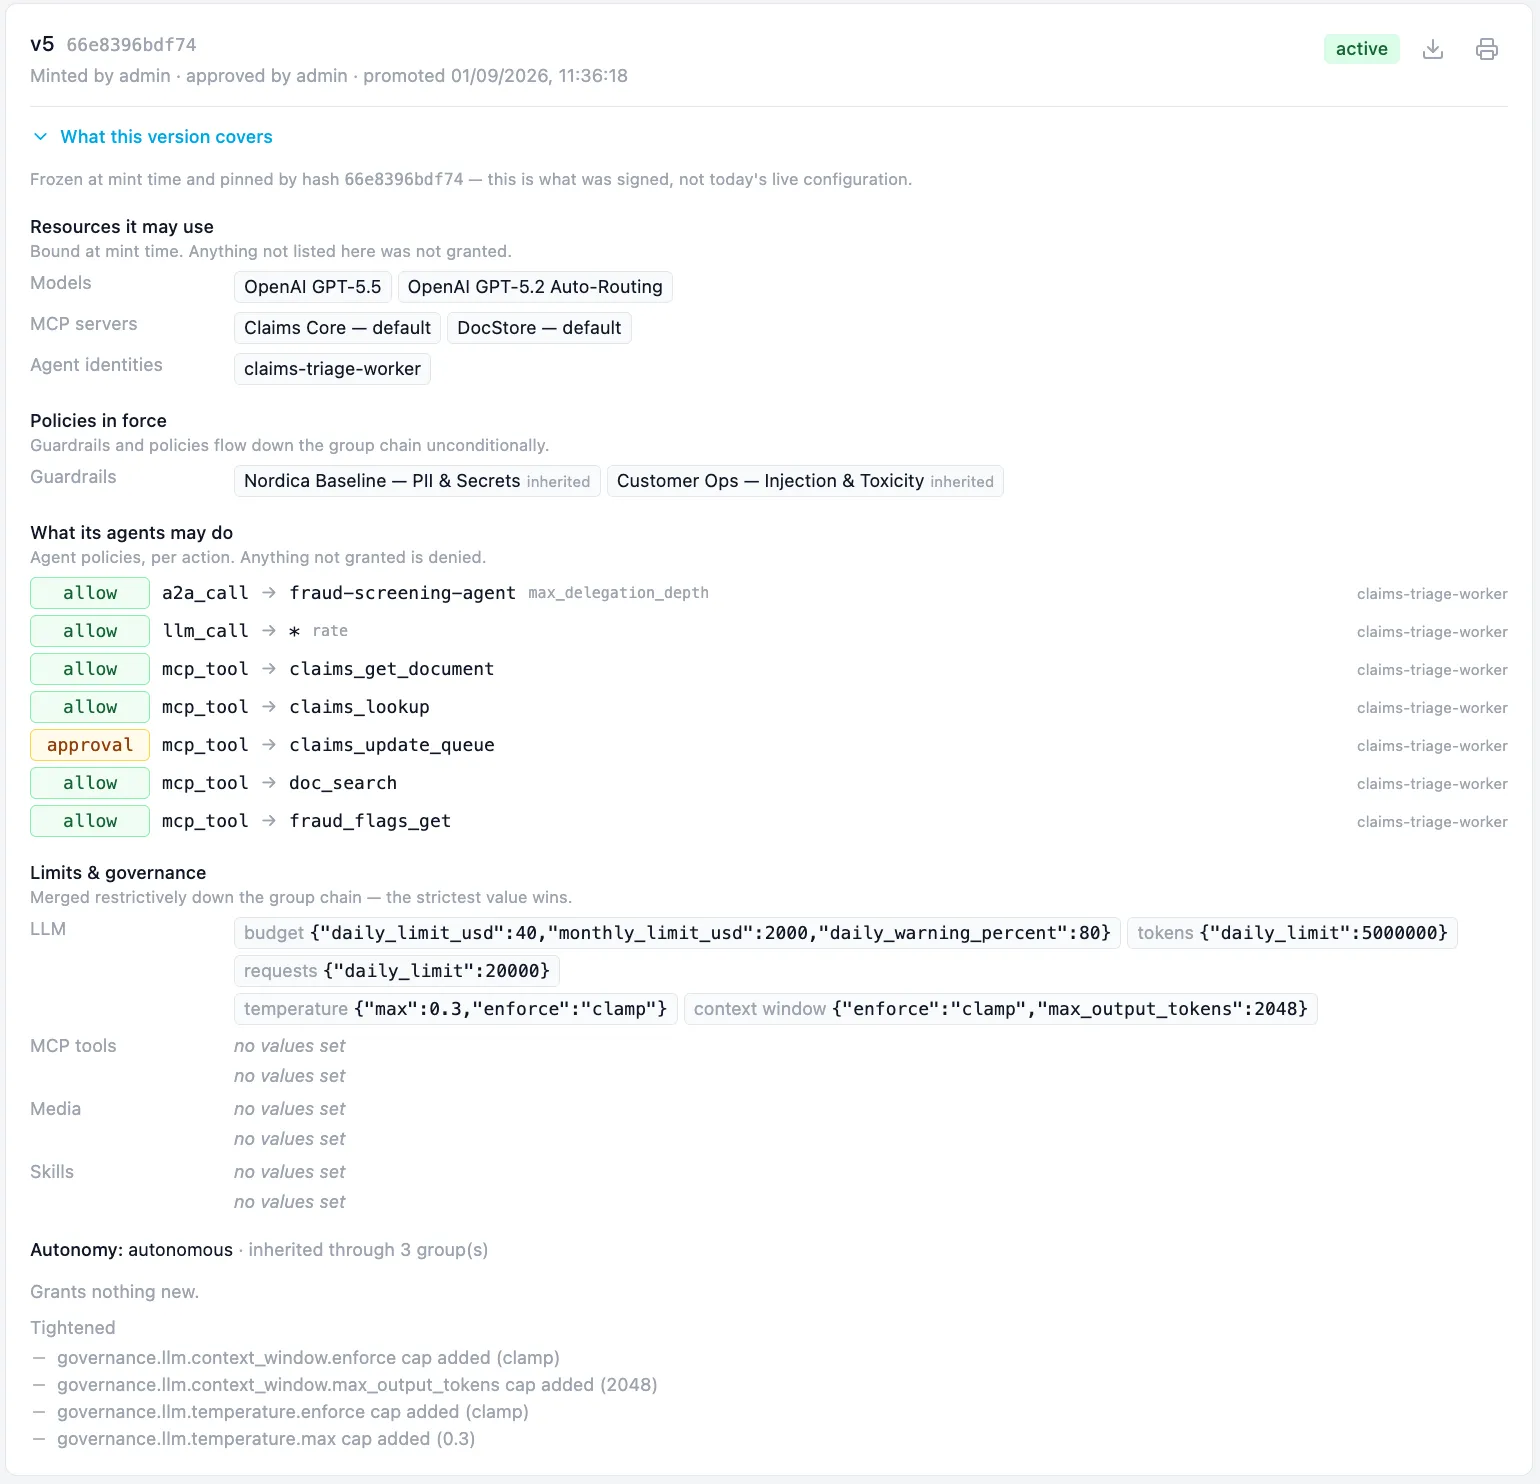
Per-run ceilings from the contract are checked at the gateway before every call; window bounds such as average cost per completed task are graded in the report and never refuse a call. Every finished run records the contract it ran under, so “what governed this?” has a provable answer months later. Before a change ships, replay rehearses it against recorded traffic offline, dispatching nothing upstream.
The Assurance Report
Section titled “The Assurance Report”The report is the artifact someone outside the platform reads. It gives a verdict in words, the evidence behind it, and an explicit account of its own limits (health and the report).
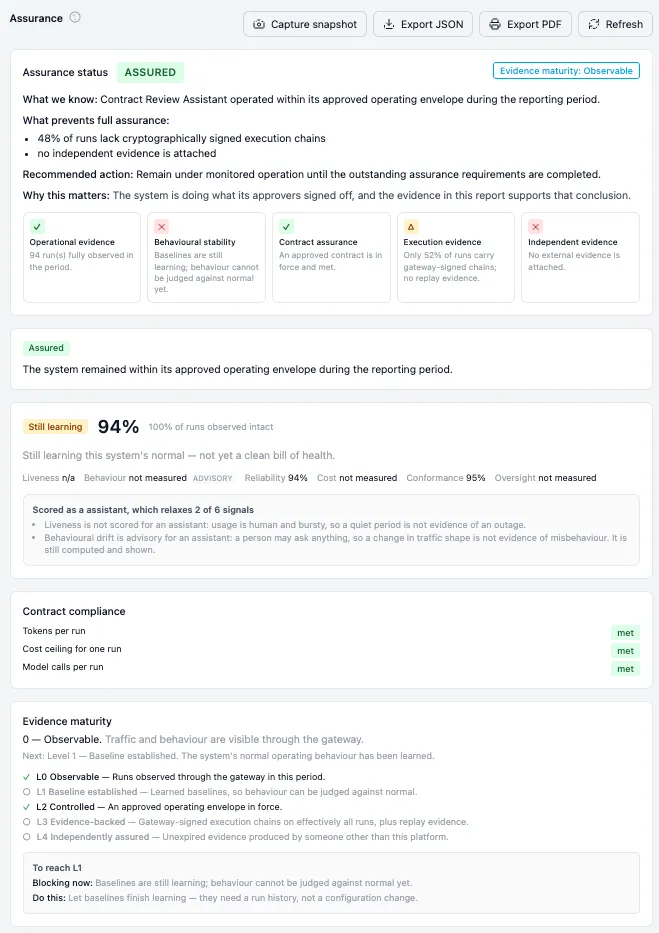
Three things in that picture are deliberate:
- Unmeasured is reported as unmeasured, never as a pass. A signal the system’s kind relaxes says so, and names the reason.
- Learned baselines are shown as learned, with how many runs they rest on, so nobody mistakes a fortnight of data for an established norm.
- The evidence maturity ladder states the rung the system has reached, the specific thing blocking the next one, and what to do about it. Snapshots are immutable, and the whole report exports as JSON or PDF for whoever asked.
AI layer
Section titled “AI layer”What the gateway fronts. Every resource below is bound to a resource group, and every call through it carries the same identity, limits, policy and audit.
Model management
Section titled “Model management”One OpenAI-compatible surface across chat, embeddings, images, audio, transcription and
video, plus the native Anthropic Messages API at /v1/messages with token counting,
so Claude-native SDKs point at Brutor unchanged
(LLM API, reference).
- A preconfigured catalog across the major providers, plus self-hosted Ollama, vLLM and KServe behind the same endpoint, and import of a model’s configuration from Hugging Face.
- The catalog carries the price list, per token, image, minute and second, which is what lets budgets, caps and cost-based routing work on real numbers.
- Central model defaults (temperature, top-p, max tokens) per model, so behaviour is consistent without per-call tweaking.
- Per-model circuit breakers, timeouts, retries and fallback chains, and tracked provider retirement dates with advance operator alerts.
- Provider keys never leave the gateway: encrypted at rest, resolved server-side, and never exposed to clients (users and API keys).
- A batch API submits large asynchronous jobs at provider batch rates over the same governed surface.
Model routing
Section titled “Model routing”A routing group is just a model name to the caller: the group picks the real model, so the fleet changes without touching client code.

- Five selection strategies: weighted random, least busy, lowest usage, lowest latency or lowest cost, set per group and changed without a redeploy.
- Failure is a fallback, not an error. A 429, 5xx or timeout retries down the chain and puts the failed model into cooldown; a prompt too long for the chosen model is re-routed to one that fits.
- Per-model RPM, TPM and concurrency are part of the selection decision, and health checks exclude unhealthy models until they recover.
- Routing can never widen access. Every member model must be granted to the calling resource group in its own right, and the log names the model that actually served.
MCP server governance
Section titled “MCP server governance”Servers are registered once; every tools/call from any client takes the governed hop
(register a server,
MCP clients).

- A catalog of ready-to-enable servers with images mirrored into Brutor’s own registry, plus bring your own: any container image, repository or remote MCP URL.
- Virtual MCP aggregation combines tools from many servers behind one endpoint, with per-group filtering and tool renaming, and the MCP Registry publishes and federates records with their governance posture.
- An OAuth proxy runs the flow per user and keeps real SaaS tokens server-side; the client only ever holds a short-lived gateway JWT.
- Capability filtering enables individual tools, resources and prompts per group, and each tool is enabled, approval-required or disabled.
- Guardrails scan arguments on the way in and results on the way back; argument and semantic policies judge what a call would do.
- Limits apply at group, server and tool scope, and a server’s region is checked against the tenant’s residency profile before it is reached.
Skills for procedure and process
Section titled “Skills for procedure and process”A skill packages instructions, scripts, reference files and templates into one versioned bundle: the procedure, not just a prompt (agent skills).

- Progressive disclosure over MCP: discover the catalog, load full instructions only when needed, then act step by step, so a skill costs very little context until used.
- Works from any MCP client, with no Brutor SDK to adopt.
- The bundle never leaves the platform. Agents receive instructions, reference content and script output, never the code, and scripts run in a sandbox with no network, a read-only filesystem and a hard timeout.
- Every step is governed independently: guardrails on skill input and output, argument policies, per-skill quotas and approval gates on each action.
- Access is by resource group, and published versions are immutable, moving through draft, validated, published, deprecated and archived.
Agent identity and agent-to-agent
Section titled “Agent identity and agent-to-agent”Every agent is a principal rather than a shared key: its own identity, a named human owner, and an optional anchor to your IdP (agent identity).

- Default-deny. A new agent can call nothing until a grant says otherwise, and nothing is implied by group membership.
- Grants are written per action (
llm_call,mcp_tool,a2a_call,skill_exec) and scoped by a glob over the target, with allow, deny or approval-required, plus time windows, delegation depth, rate and expiry. - Dry-run before you enforce: Brutor records what would have been blocked without blocking it.
- Native A2A v1.0 inbound and outbound (A2A agents), with Ed25519-signed agent cards published at a well-known URL, HMAC-signed delegation chains, the full task lifecycle with streaming, and per-card rate limits.
Knowledge bases for internal content
Section titled “Knowledge bases for internal content”The retrieval pipeline is already built: chunking, embedding, hybrid search, permission filtering and citation (knowledge bases).

- Qdrant ships in the deployment and you operate it; Brutor manages what lives inside it, including the per-tenant collection and short-lived scoped tokens.
- Eight connectors (Confluence, Notion, Google Drive, Slack, GitHub, Jira, SharePoint and a web crawler) sync on a schedule, or upload files directly.
- Hybrid retrieval: dense vectors and BM25, fused with reciprocal rank fusion, so a reworded question and an exact part number both land.
- Source permissions still apply. A synced document keeps its origin ACL, and retrieval filters to what the asker could have opened themselves.
- Collections are bound per resource group, answers carry citations, and every retrieval is on the same audit trail as the call it grounded.
Governance layer
Section titled “Governance layer”Guardrails
Section titled “Guardrails”Six checks (PII, secrets, prompt injection, jailbreak, toxic content and your own banned words) run inline on every surface (guardrails).

- Bring your own detector, per check: the built-in in-process detector, Microsoft Presidio, AWS Bedrock Guardrails, Lakera Guard, OpenAI moderation, or your own endpoint. Built-in means nothing about the request leaves your deployment to be scanned.
- Most restrictive action wins when several apply: a provider can tighten a decision, never loosen it.
- Every surface, not just chat: LLM input and output, streaming, embeddings, image, audio, batch, MCP tool calls, skills and A2A. Streaming is guarded either by buffered release or by cutting the stream mid-token.
- It fails closed. Retry, then circuit breaker, then the built-in detector, then refuse. Break-glass is explicit, time-limited and recorded.
Governance policies
Section titled “Governance policies”Two engines, one rollout discipline (policies).

- Argument policies ask what a call would do. Deterministic SQL, URL, shell, path and JSON analyzers read the arguments before anything executes, on the model’s own tool calls, on MCP input and on skill input. Run at warn, promote to deny.
- Semantic policies ask what it means. A plain-language constraint judged by a model, run in shadow first so real violations are recorded while nothing is blocked.
- Agent policies ask whether the agent may act at all (see agent identity and agent-to-agent).
- Policy-as-code, not a wiki page. Export a resource group’s configuration as versioned YAML, validate it against the schema, dry-run to see what would change, apply it as a bundle, then diff two versions and roll back one.
Usage limits and resource groups
Section titled “Usage limits and resource groups”One tree shaped like your org chart, from organization down to a single agent. Every model, server, skill, guardrail, member, key and limit is scoped to a node in it (resource groups, limits).

- Resources compose additively and each inheritance is gated, so a parent can withhold rather than pass everything down.
- Limits compose restrictively: the effective value is the most restrictive across the node and every ancestor. A $500 cap under a $400 department is still $400, which is what makes delegation safe.
- Dollar, token and request caps for LLM and MCP traffic alike, enforced in real time: the next call over the line is refused rather than reconciled later.
- Run-level ceilings for agents: cost, tokens, model calls, delegation depth and active time per run (the clock pauses while a human approval is pending), so one looping agent cannot consume a team’s day.
- Tenant-wide controls can be set directly on one model, server or skill and merge into the same calculation, and agents are members like anyone else.
Audit and compliance
Section titled “Audit and compliance”Two separate trails: what the AI did, and who changed what it was allowed to do (compliance, audit row reference).

- Proxy logs: one row per call with who called, which model or tool answered, the decision, tokens and cost, and which rule fired, including refusals.
- Tamper-evident by construction. Each row hashes onto the previous, and the writer Ed25519-signs the head of each flushed batch into a checkpoint that stores the key that signed it, so rotation does not invalidate history.
- The change trail carries each resource’s author, editor and version, and destructive operator actions get their own rows.
- Compliance tagging is opt-in: declare GDPR Article 30, SOC 2, HIPAA, EU AI Act or ISO 42001 and tags are written as calls happen; declare none and the engine never runs.
- Sealed action records. With an evidence key configured, every governed verdict — refusals included — is also sealed as a signed record into a per-tenant Merkle log whose tree heads independent witnesses countersign, so a party outside your organisation can check it with standard COSE/SCITT tooling. See the compliance evidence programme.
- The Asset Register inventories every model, tool, skill and agent with a fact sheet and append-only snapshots, and evidence exports to S3, Splunk HEC or a JSONL webhook (logs).
Operations layer
Section titled “Operations layer”Caches
Section titled “Caches”Two caches that save in different ways, both surfaced in Mission Control with hit rate and spend avoided (tokenomics).
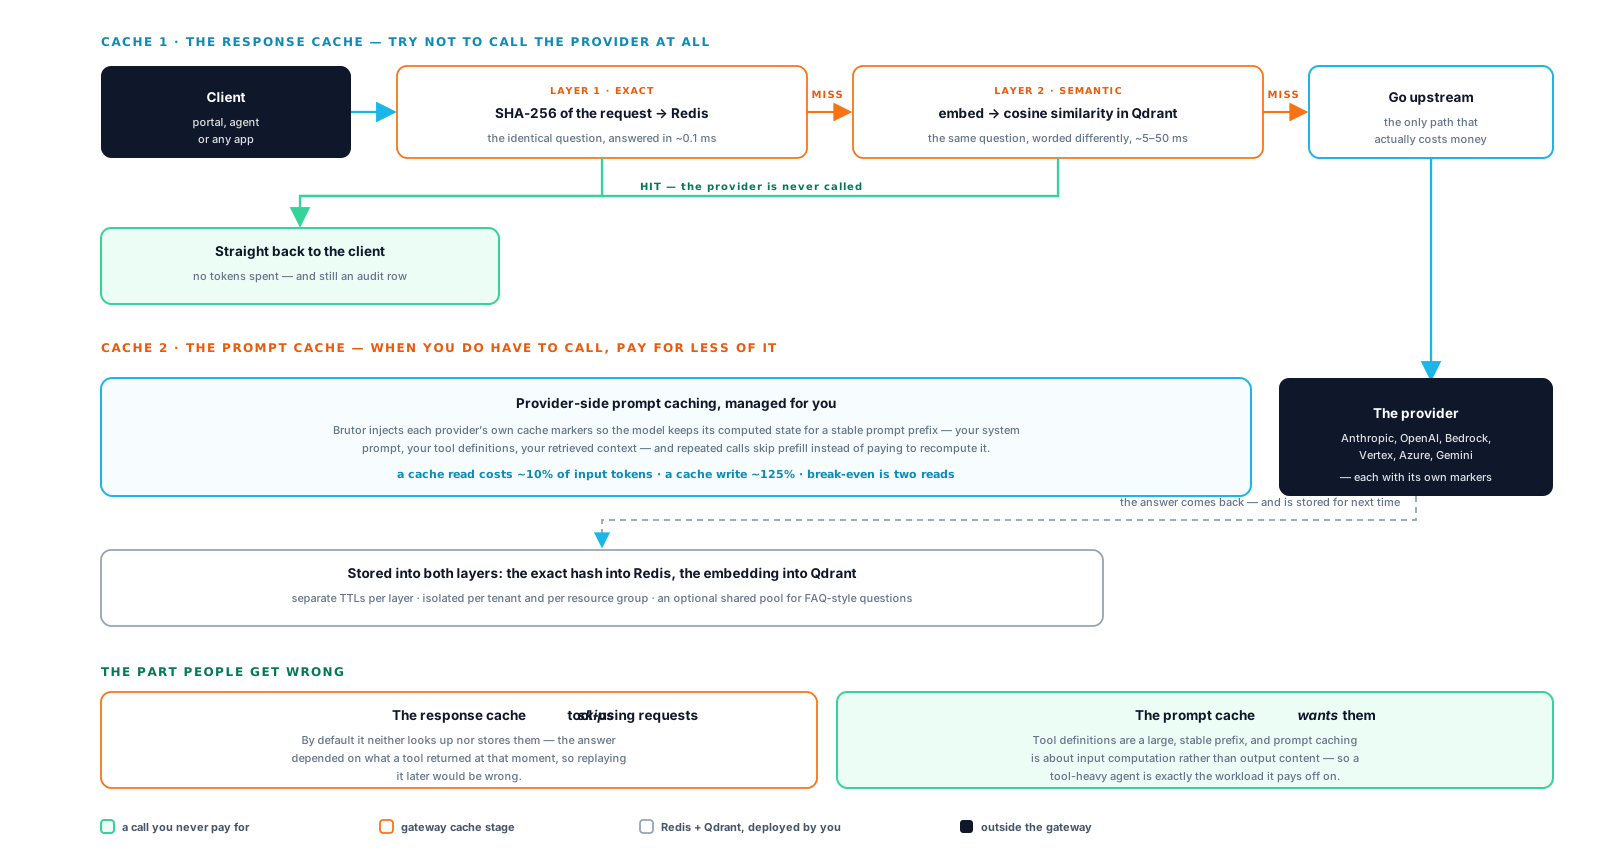
- Response cache, layer 1: an exact hash lookup in Redis. Layer 2: a semantic match in Qdrant above a similarity threshold you set. A hit calls no provider, spends no tokens, and still writes an audit row.
- Isolated per tenant and per group, with optional sharing for FAQ-style questions, and time bucketing so a “this month” question does not return last month’s answer.
- Tool-using requests are skipped by default: the answer depended on what a tool returned at that moment.
- Prompt cache: Brutor injects each provider’s own cache markers so repeated calls skip prefill. A read costs roughly a tenth of the input tokens and a write roughly a quarter more, so break-even is two reads, which is why it belongs on stable prefixes such as tool definitions and long system prompts.
Cost control and FinOps
Section titled “Cost control and FinOps”Attribution by provider, model, team and individual user on one screen, with agent and unattributed spend shown as its own line rather than spread across users (Mission Control).
- Governed and observed side by side in the same total, so bought AI sits next to built AI (traffic data import).
- Unit economics, not just totals: cost per thousand requests, average cost per request and average tokens per request, plus cost per completed task and the workload’s growth class.
- Budget burn-down against the caps enforced in usage limits and resource groups, with alerts and an acknowledgement workflow before the invoice.
- Cost avoided is measured, not assumed: the gateway cache’s estimate and the provider prompt cache’s measured discount are reported as two different numbers.
- Levers: cost-based routing, batch submission at provider batch rates, and the two caches.
Analytics and observability
Section titled “Analytics and observability”Seven views over one dataset (traffic, cost, LLM economics, governance, caching, agents and reliability) rather than seven disconnected dashboards (metrics, logs).
- Broken down by surface (LLM, MCP, A2A, Portal) with first-class MCP and A2A views: per-method counts, duration and success rate, and per-capability figures per agent card.
- Enforcement outcomes as numbers: guardrail blocks as a count and a share, policy denials, detections, and how many requests were inspected at all, which is the difference between “nothing fired” and “nothing was checked”.
- Discovery coverage as a fraction: governed assets over discovered assets, with shadow AI named, typed and actionable from the list (shadow AI discovery).
- Un-approved model spend is surfaced with what it cost, and per-framework compliance coverage says plainly when a framework is not enabled.
- Bring your own stack. Native OpenTelemetry feeds Prometheus, Grafana, Loki or any OTLP backend you already run, and live reachability for every model and MCP server turns a failing dependency into a red component rather than a mysterious error rate.
Drop in, and out
Section titled “Drop in, and out”Nothing here asks you to write against a Brutor SDK. Point an existing OpenAI or Anthropic client at the gateway’s base URL; MCP and A2A are the real protocols, not a dialect (CLI, coding agents). The posture exports as YAML for Git, the register and audit evidence export in standard formats, and the deployment is a single Rust binary on your own infrastructure (architecture).
Observing bought AI
Section titled “Observing bought AI”Not all AI traffic can route through a gateway, and Brutor does not pretend otherwise. Two mechanisms bring the rest into the same picture — observed, costed and attributed, but never enforced:
- Traffic Data Import calls provider enterprise APIs — usage and spend exports for the ChatGPT, Claude and Copilot seats you buy — and lands them in the same usage ledger as routed traffic. FinOps sees one number per team and provider, whether the tokens went through the gateway or not.
- Shadow AI Discovery collects the non-routable and unregistered traffic: discovery agents and adapters send signed events about AI usage found on the network, in repositories or in expense data — agents nobody registered, MCP servers nobody governs.